Home / Blog / Strategy Testing & Automation
Strategy Testing & Automation
Futures trading strategies for prop traders, ranked by difficulty
There is no best futures trading strategy, and nothing here shows any of them to be profitable. What can be compared is how each one fits prop firm rules: how big its stop usually is, how often it trades, how fast a losing streak eats a $2,000 drawdown, and which rule it tends to break first. This post scores 15 common futures day trading strategies on exactly that, and ranks them from simplest to hardest to run inside a prop account.
The ranking is our judgement, not a measurement. It combines two things: how precisely the rules can be written down (a strategy you cannot define, you cannot test), and how much friction it meets from the rulebook. A strategy can be simple to understand and still rank low because it fights the rules, as swing trading does.
Free tool · free with your email
Position size calculator
Turn today's loss budget and your stop into a contract count.
✓ It's yours. The link is on its way to your inbox. Open the position size calculator now
See what the position size calculator does firstThe yardstick: one account, one budget
Every strategy below is measured against the same example account, so the numbers compare. These are example figures, not results, and your plan's numbers decide:
- A
$50,000evaluation with a$2,000trailing drawdown, so the floor starts at$48,000 - An example daily loss limit of
$1,000 - An example risk budget of
$200per trade - MNQ, the micro Nasdaq-100 future:
$0.50a tick,$2a point (CME Group contract specs; see our MNQ tick value post)
Sizing follows one formula: contracts = $200 ÷ (stop in points × $2), rounded down. Sized that way, every full stop costs at most $200, so:
- the example daily limit stops the day after
5full stops (5 × $200 = $1,000) - the drawdown is gone after
10full stops (10 × $200 = $2,000), fewer if the floor has trailed up
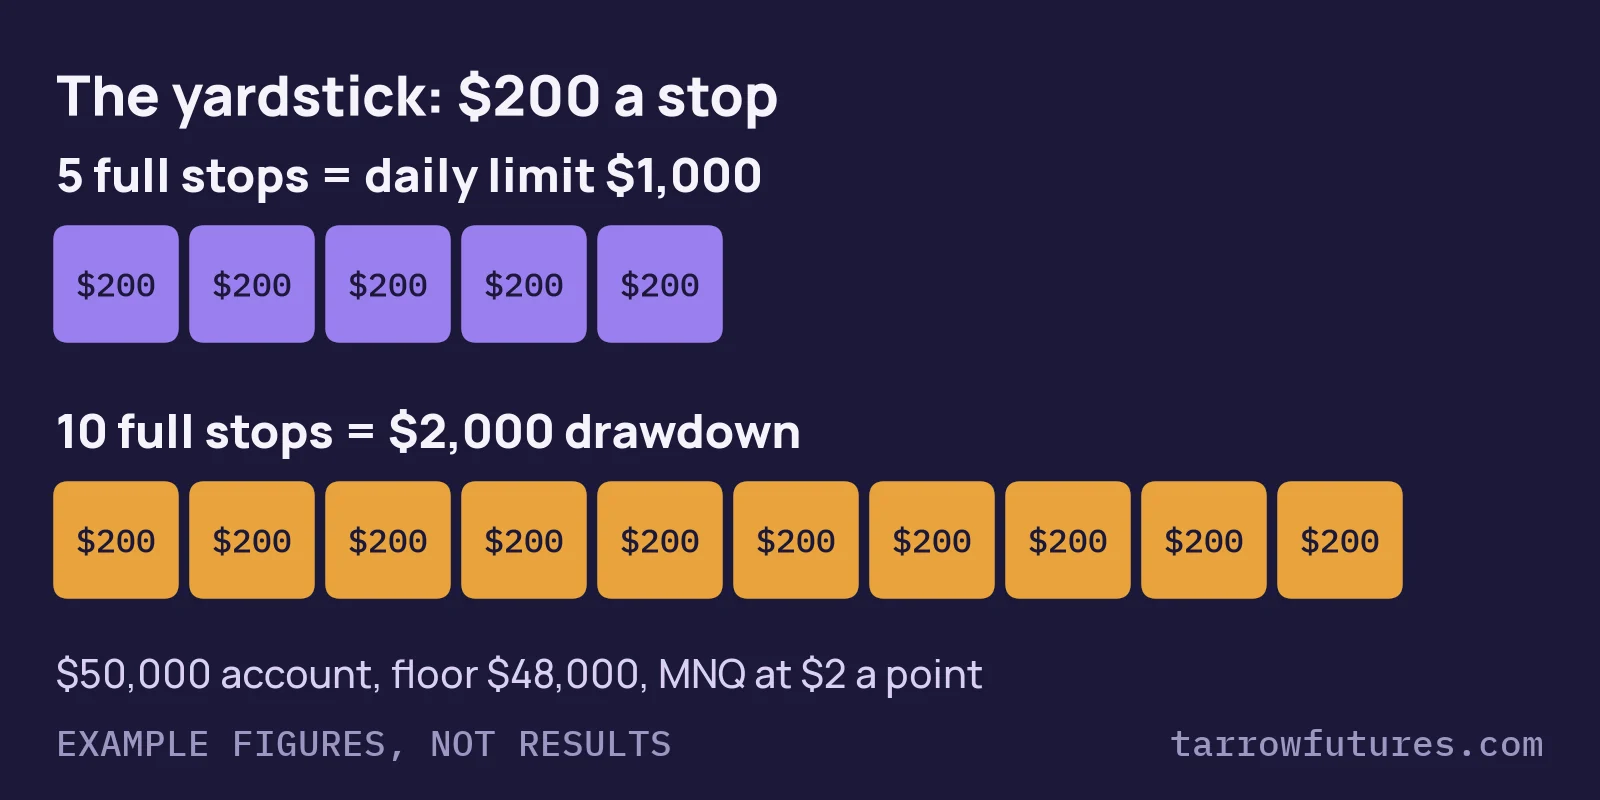
What changes from strategy to strategy is whether the stop fits the budget at all, how quickly five stops can arrive, and whether open profit lifts the floor under an intraday trailing drawdown. The example stop sizes in this post are assumptions chosen to illustrate each style, not measurements; real stops vary by day, and the rule set you write decides yours.
The ranking at a glance
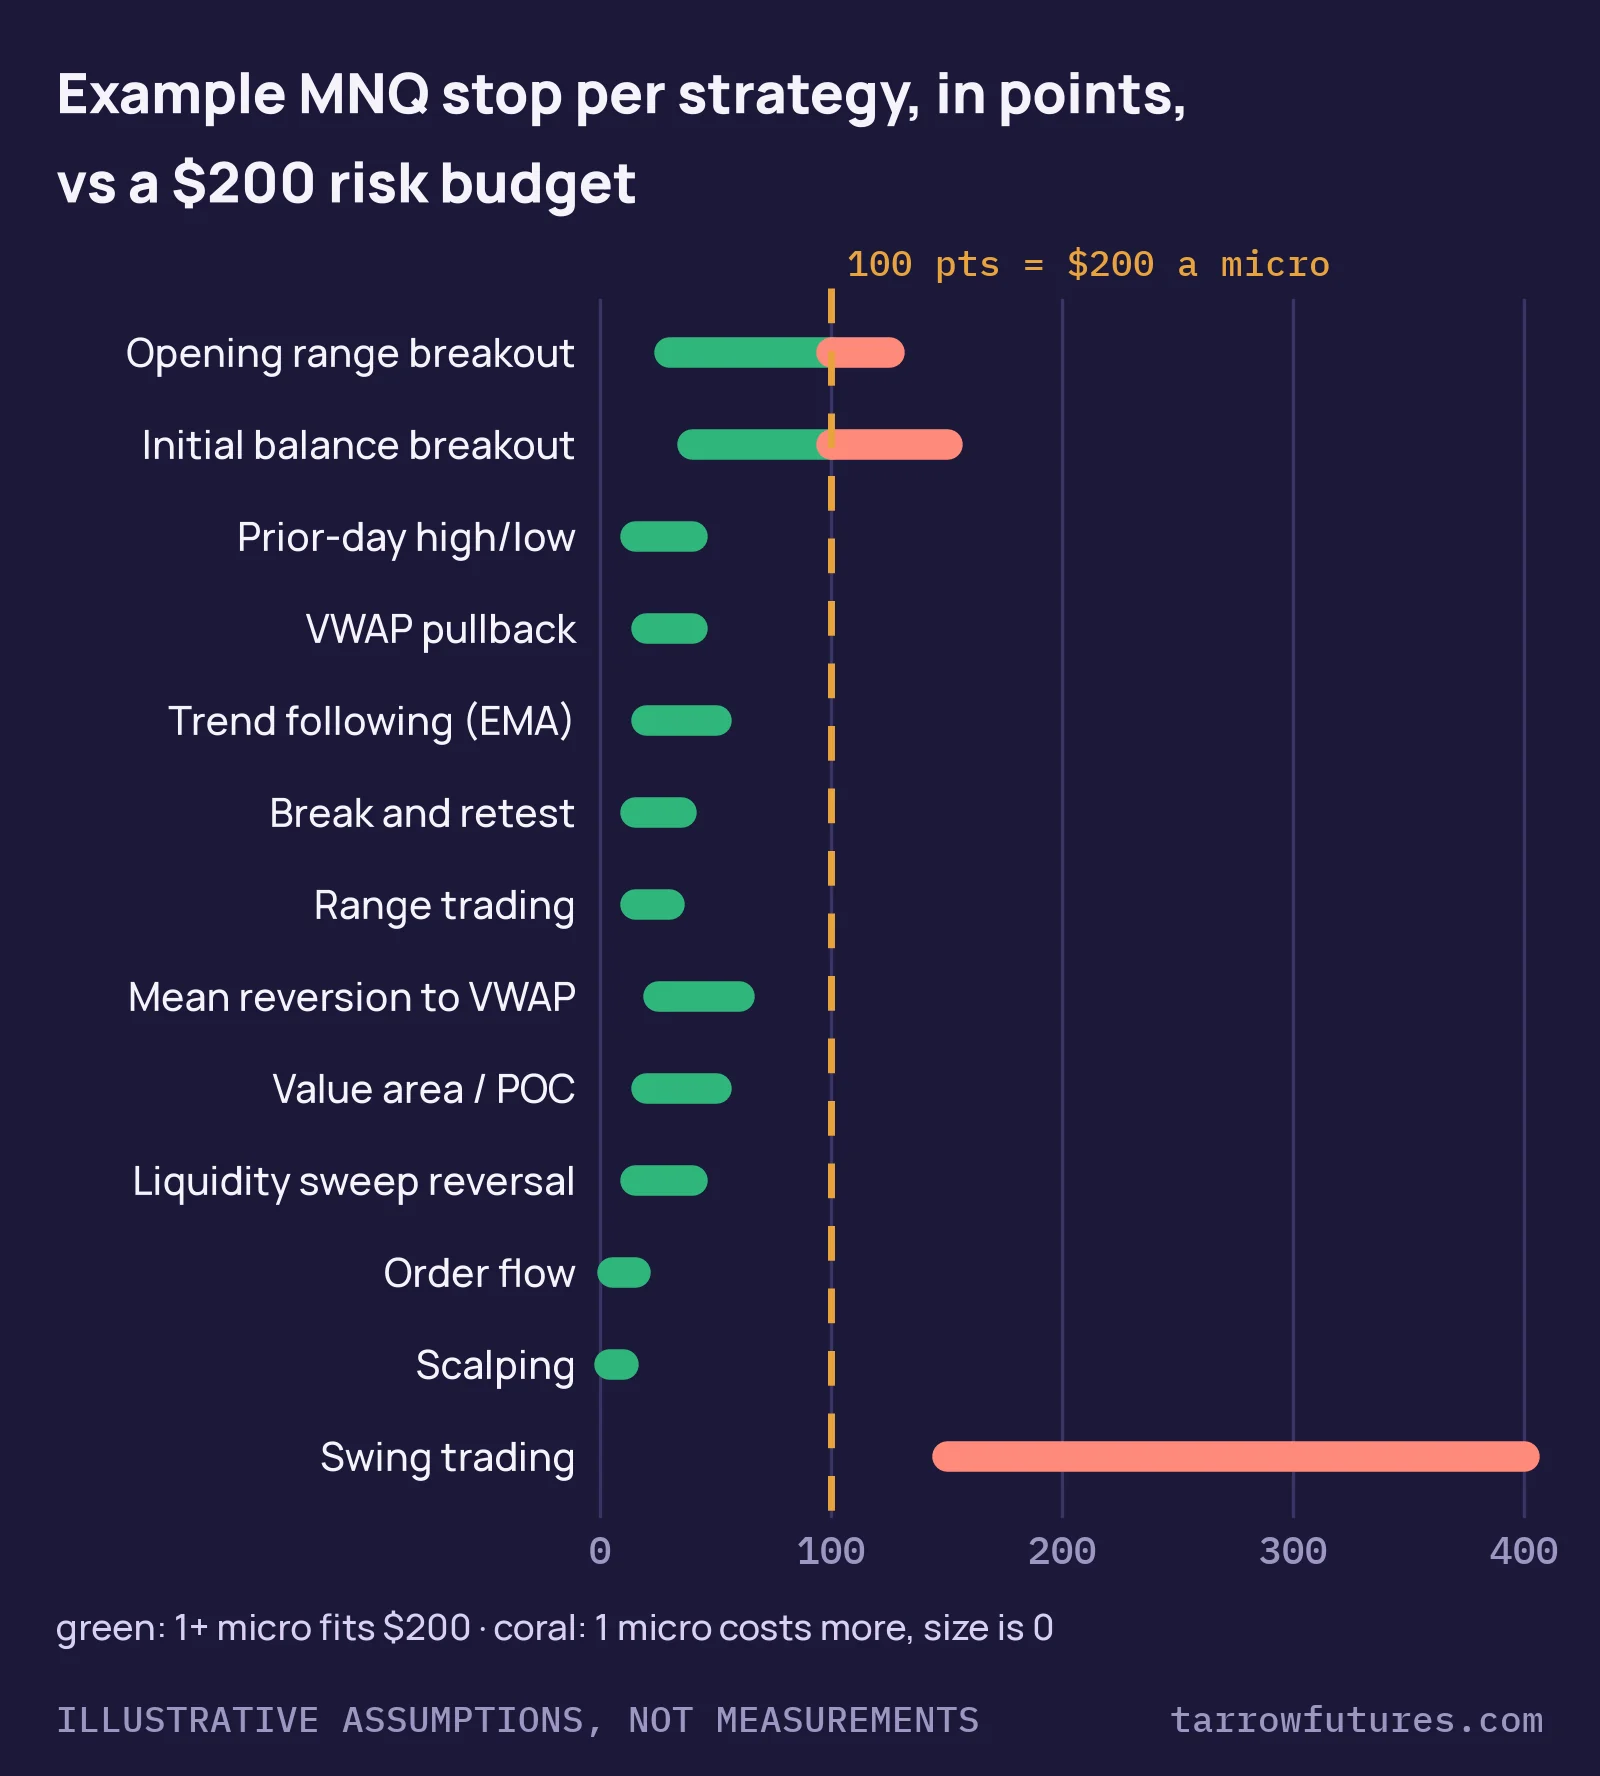
| # | Strategy | Example MNQ stop | Per micro | Micros at $200 |
Trades a day | Rule that bites first |
|---|---|---|---|---|---|---|
| 1 | Opening range breakout | 30–125 pts |
$60–$250 |
3 to 0 |
1 (by rule) |
Wide-range days |
| 2 | Initial balance breakout | 40–150 pts |
$80–$300 |
2 to 0 |
1 (by rule) |
Wide-range days |
| 3 | Prior-day high/low | 15–40 pts |
$30–$80 |
6 to 2 |
1–2 |
Daily limit on chop |
| 4 | VWAP pullback | 20–40 pts |
$40–$80 |
5 to 2 |
1–2 (capped) |
Daily limit on chop |
| 5 | Trend following (EMA) | 20–50 pts |
$40–$100 |
5 to 2 |
1–4 |
Intraday trailing |
| 6 | Break and retest | 15–35 pts |
$30–$70 |
6 to 2 |
1–3 |
Daily limit |
| 7 | Range trading | 15–30 pts |
$30–$60 |
6 to 3 |
2–4 |
Breakout days |
| 8 | Mean reversion to VWAP | 25–60 pts |
$50–$120 |
4 to 1 |
1–3 |
Trend days |
| 9 | Value area / POC | 20–50 pts |
$40–$100 |
5 to 2 |
1–3 |
Subjective levels |
| 10 | Liquidity sweep reversal | 15–40 pts |
$30–$80 |
6 to 2 |
1–3 |
Subjective reads |
| 11 | Order flow | 5–15 pts |
$10–$30 |
20 to 6 |
many | Data and skill |
| 12 | Scalping | 4–10 pts |
$8–$20 |
25 to 10 |
many | Costs, daily limit |
| 13 | News trading | unknowable | — | — | 1–2 |
News rules, slippage |
| 14 | Swing trading | 150–400 pts |
$300–$800 |
0 |
under 1 |
Overnight rules |
| 15 | Spread trading | varies | — | — | 1–2 |
Platform and rule support |
Stops and trade counts are illustrative assumptions for one example rule set each, not measured averages. "Micros at $200" is the sizing formula applied to each end of the stop range.
The simplest to define: fixed levels at fixed times
1. Opening range breakout
Mark the high and low of the first minutes after the 9:30 ET open (15 is a common choice), then trade the first close outside that range, with the stop on the other side. It ranks first because every part is a number: the window, the break, the stop, the exit. The hard part is that the range sets the risk, and the range changes every day. On a narrow morning the stop is small; on a wide one, a single micro can cost more than the $200 budget, which means the right size is zero. One trade a day keeps the losing streak slow. Full rules and two selected past sessions on TradingView charts (one that reached its target, one that stopped out) are in the opening range breakout breakdown and the ORB post.
2. Initial balance breakout
The same idea on a longer clock: the initial balance is the first hour's range (9:30–10:30 ET), and the trade is a close outside it. A common version puts the stop at the middle of the range rather than the far side, which halves the risk compared with the full range. It ranks second only because the first hour is usually wider than a 15-minute window, so more days push the stop to or past the budget's edge. On a 150-point stop, one micro risks $300 and the right size is zero. See the initial balance breakout breakdown and its blog post.
3. Prior-day high and low
Yesterday's regular-session high and low are objective levels everyone can see. Rule sets either trade a close through one of them or a rejection back from it. Stops are usually tighter than a breakout of a whole range, so the sizing is friendlier. The difficulty is definition: you must decide whether "prior day" means the regular session only or the full electronic session including overnight, and what to do when price opens beyond the level. Choppy days that cross the line repeatedly are where the daily limit gets tested, so a cap of one or two attempts belongs in the rules. See the prior-day high/low breakdown and its blog post.
4. VWAP pullback
In a session that is trending away from VWAP (the volume-weighted average price), wait for price to pull back toward it, then trade in the trend's direction with a stop beyond the pullback. Stops are moderate, and a written cap of two trades a day turns a bad day into two stops, not five. What makes it harder than the first three: "trending" has to be defined as a number, or every judgement call becomes a rule you did not test. The VWAP pullback breakdown shows a green day, a red day and the cap that kept the red one small; the post covers the rules.
Free toolSkip the arithmetic: the position size calculator does this for your own numbers.Get it ↓The middle: rules you can write, judgement you must limit
5. Trend following with moving averages
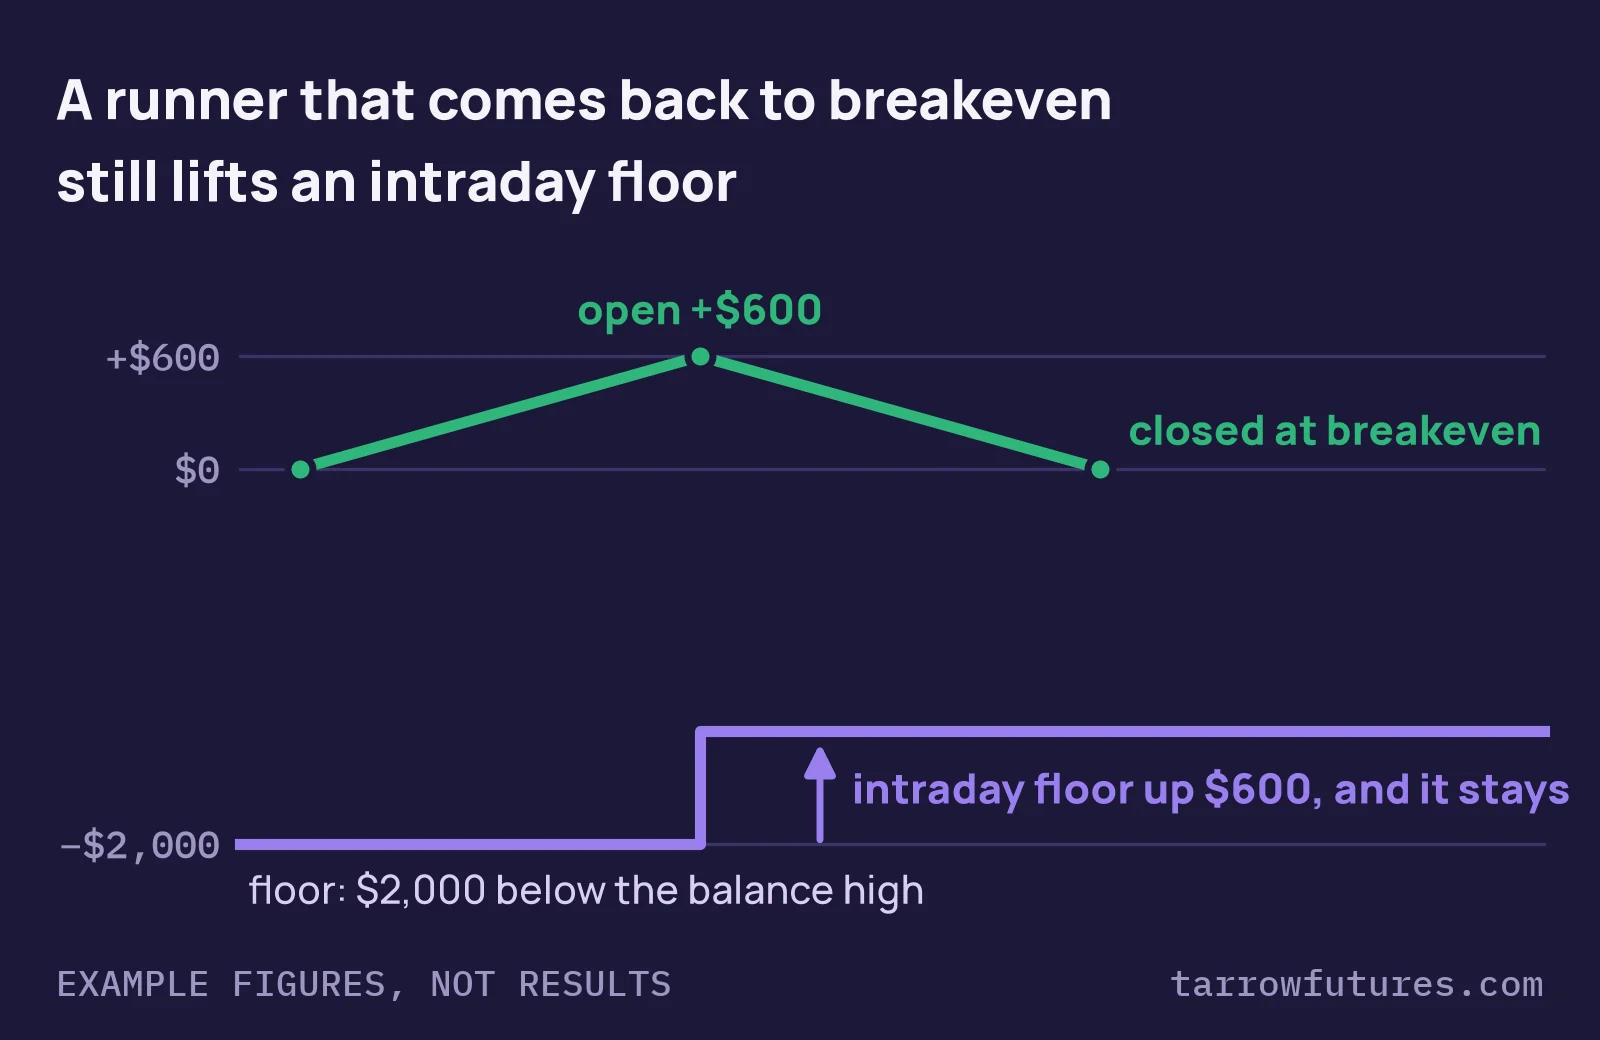
A fast and a slow exponential moving average (9 and 21, or 20 and 50, on 1- to 5-minute bars are common choices) define direction; trades go with the trend, often on a cross or a pullback to the fast line. The rules are simple to code. The rule that bites is the intraday trailing drawdown: trend trades let winners run, and a trade that runs +$600 open from a fresh balance high and comes back to breakeven has still lifted an intraday floor by $600. Example figures, not results. On sideways days, crosses also come in clusters, so a daily trade cap matters.
6. Break and retest
Price breaks a level, comes back to test it from the other side, and the trade goes with the original break. The stop can sit just past the retested level, so it is often tight. The difficulty is that "a retest" needs exact edges: how close counts as a touch, how long you wait, and what happens if price never comes back. See the break and retest breakdown and its blog post.
7. Range trading
When price is moving sideways between a clear high and low, sell near the top and buy near the bottom, with stops just outside. Stops are small and the trades are frequent, which is where the daily limit starts to matter: two to four trades a day means five stops can arrive by lunchtime on a day the range breaks. The hard part is the one rule nobody can write in advance: when the range has ended. A hard daily stop and a cap on attempts do more work here than in any strategy above.
8. Mean reversion to VWAP
The opposite bet to the VWAP pullback: when price stretches far from VWAP (often measured in standard-deviation bands), trade back toward it. The stop has to sit beyond the extreme, so it is wider and less predictable, and on a strong trend day price can keep stretching. That is the losing streak to plan for: several stops in the same direction on one day. Under the yardstick, one micro at a 60-point stop risks $120, so only one micro fits the $200 budget. See the VWAP mean reversion breakdown and its blog post.
9. Value area and point of control
Volume profile shows how much traded at each price. The point of control is the price with the most volume; the value area is the range around it holding most of the session's volume (by the usual convention about 70%, the figure used in Market Profile teaching). The approach comes from auction market theory and the Market Profile work J. Peter Steidlmayer developed at the Chicago Board of Trade in the 1980s. Common rule sets trade a return into the prior day's value area, or a rejection at its edge. It ranks in the middle because the levels are objective once computed, but which profile (session, composite, which hours) is a choice, and different choices give different levels. Write the choice down before testing.
10. Liquidity sweep and reversal
Plainly: price pushes just past an obvious level such as a prior high, where many traders keep their stops, triggers them, then reverses back inside. The trade goes with the reversal, with a stop beyond the extreme of the push. Stops are often tight, which makes the sizing look attractive. The difficulty is that "swept and reversed" and "broke out and kept going" look identical for the first few bars. Any rule has to say exactly how far past the level, and how quickly back inside, counts. Without that, it is a story told after the fact.
The hardest to run inside prop rules
11. Order flow
Order flow trading reads the trades themselves: the depth of market, footprint charts showing volume at bid and ask, and cumulative delta. Stops can be very small, so the formula allows many micros. It ranks this high for difficulty because the skill is in reading, not in rules, and reads are hard to backtest. It also needs data feeds and platform tools that cost money, and your platform's data may not match what the firm's engine records.
12. Scalping
Many small trades, small targets and small stops. A 6-point stop is $12 a micro, so the formula allows 16 micros at $200. The rule that bites first is cost: commissions and slippage scale with contracts and trades, and one tick of slippage on entry and one on exit is 0.5 points, a twelfth of a 6-point stop. Frequency is the other problem: at many trades a day, five full stops can arrive in an hour, so the daily limit matters more than the drawdown. Some rulebooks also restrict very short holding times; check yours.
13. News trading
Trading the release of scheduled data such as CPI, payrolls or the FOMC decision. Its stop is listed as unknowable because the fill is: in a fast market a stop order becomes a market order and can fill well past its price, so the planned $200 risk can turn into several times that. Some prop plans restrict trading in a window around these releases, and a breach can end the account regardless of the P&L. A single large news day can also run into a consistency rule that caps your best day.
14. Swing trading
Holding positions for days to catch larger moves. Simple to understand, hard to run in a prop account for two reasons. First, many evaluation plans require you to be flat before the session closes, which rules out overnight holds. Second, the stops are large: at a 300-point stop, one micro risks $600, three times the example budget, and four stops in a row take a fresh $2,000 drawdown. In the yardstick account the right size is zero micros.
15. Spread trading
Holding two related contracts at once: a calendar spread (this month against next) or an intermarket spread (for example, Nasdaq against S&P futures). The risk is the gap between the two, not the direction of either. It ranks last for prop traders because the account's rules usually see two separate positions: each leg may count toward the contract limit and the drawdown on its own, and some rulebooks restrict holding opposite or offsetting positions. Exchange-recognised spreads may not be available on the firm's platform at all. Check before designing one.
What the ranking shows
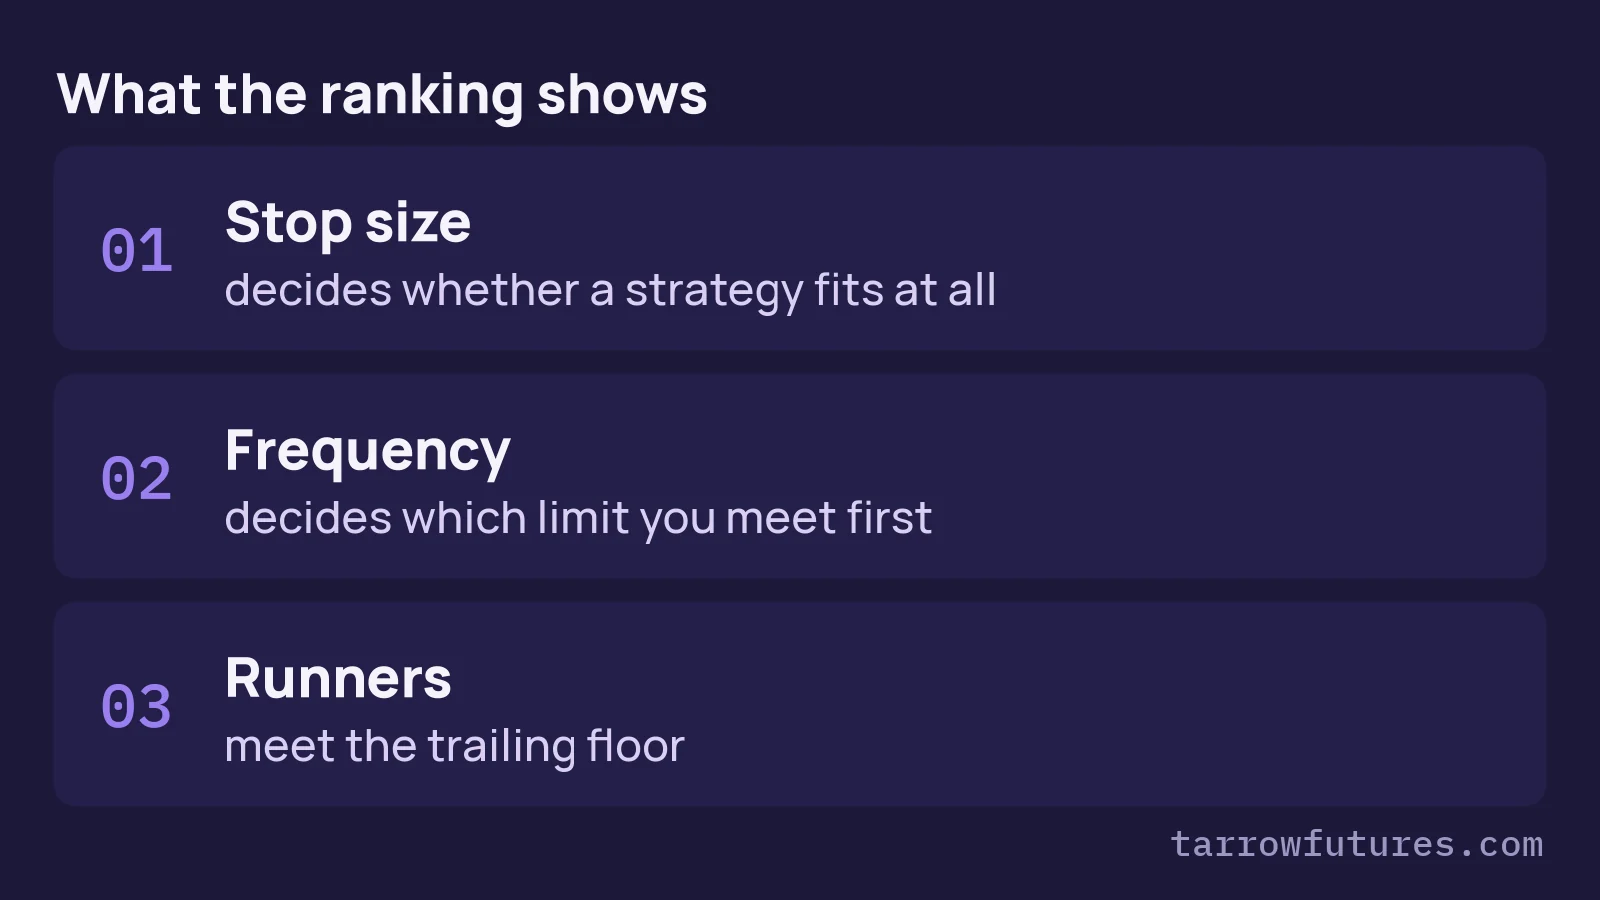
Three patterns run through the table:
- Stop size decides whether a strategy fits at all. Sized from a fixed budget, a wide-stop strategy is not riskier per trade, it is just smaller, until one micro costs more than the budget and the correct size is zero. The how many contracts post works this through.
- Frequency decides which limit you meet first. One trade a day meets the drawdown slowly. Many trades a day meet the daily loss limit fast, often on the same morning.
- Runners meet the trailing floor. Under an intraday trailing drawdown, any strategy that lets open profit build and give some back pays twice. Under an end-of-day drawdown the open swing does not move the floor, but the close does.
Before you pick one
Whichever strategy you look at: write the rules so two people would code them the same way, backtest them with commissions and slippage over many sessions, size them from the stop and your plan's daily limit, and forward-test on a simulator before risking an evaluation fee. Our free guide, Build It, Break It, Then Trade It, walks through those steps, and the drawdown room calculator shows how many stops your current room can take.
The position size calculator below turns your loss budget and any strategy's stop into a contract count, so you can see before the open whether today's stop fits.
Every number in this post is an example or an assumption for illustration, not a result, and no strategy here is presented as profitable. Rules differ between firms and plans; your firm's current rulebook decides.
Free tool · free with your email
Position size calculator
Turn today's loss budget and your stop into a contract count. We email you the link, so it is one tap away next time.
✓ It's yours. The link is on its way to your inbox. Open the position size calculator now
See what the position size calculator does firstQuestions
What is the best futures trading strategy for beginners?
No strategy has been shown to be the best, and none is shown here to be profitable. For learning, the strategies that are simplest to write down exactly are the ones built on fixed levels and fixed times, such as an opening range breakout, an initial balance breakout or the prior day's high and low. Simple to define is not the same as profitable; test any rule set with costs before trading it.
What is the best prop firm trading strategy?
There is no proven answer. A strategy fits a prop account when its typical stop, sized from your loss budget, leaves room for a normal losing streak under the daily loss limit and the trailing drawdown, and when it does not break rules such as overnight holds, news windows or a consistency cap. Whether it makes money is a separate question that only your own testing can address.
How many contracts can I trade with a $2,000 drawdown?
Size from the stop. Contracts = risk per trade divided by (stop in points times the point value), rounded down. MNQ is $2 a point, so with an example $200 risk per trade and a 25-point stop, that is 200 / (25 x 2) = 4 micros. A wider stop means fewer contracts, and some stops are too wide for even one.
Can I swing trade in a futures prop firm account?
Many evaluation plans are intraday only and require you to be flat before the session closes, which rules out holding overnight. Some plans differ. Read the current rulebook for overnight and weekend holding before you plan a swing trade.
Is scalping allowed in a prop firm?
Scalping itself is a style, not a rule break, but some rulebooks restrict very short holding times or specific high-frequency patterns, and costs grow with the number of trades and contracts. Check the rulebook, and count commissions and slippage on every fill.
Can you trade the news in a prop firm account?
Some plans restrict trading in a window around scheduled releases such as CPI or FOMC, and some do not. Stop orders can also fill well past their price when the market moves fast. Read the news rule in your plan before trading near a release.
What are the most common futures day trading strategies?
Breakouts (opening range, initial balance, prior-day levels), pullbacks to VWAP or a moving average, trend following, range trading, mean reversion, break and retest, volume profile levels, stop-run reversals, scalping, news trading, swing trading, spread trading and order flow. This post scores each one against prop firm rules.
Educational material only. Not financial, investment or trading advice, and not a recommendation to trade any contract or size. Prop firm rules differ and change; the current rulebook of the firm you use decides. Worked examples use example figures, not results. Futures trading involves substantial risk of loss. Evaluations are paid tests and most people who take one do not pass.