Home / Blog / Strategy Testing & Automation
Strategy Testing & Automation
What is the opening range breakout strategy?
The opening range breakout (ORB) strategy marks the high and low of the first few minutes after the market opens, then enters a trade when price closes outside that range, in the direction of the break. The stop usually goes on the other side of the range, so the size of the opening range sets the risk of the trade.
That is the whole idea. What makes it a strategy, rather than a slogan, is writing each part down as a number: which minutes make the range, what counts as a break, where the stop and the exit go, and how many contracts you trade. This post goes through each, with a real MNQ morning, and shows why the sizing rule matters most if you trade inside a prop account with a trailing drawdown.
The opening range, defined
For US index futures (MNQ, NQ, MES, ES), "the open" almost always means the cash-session open at 9:30 ET (8:30 CT). The futures trade nearly around the clock, but that is when volume and range jump.
The opening range is the highest high and the lowest low from 9:30 to the end of your window. Common windows:
| Window | Range ends | Trade-off |
|---|---|---|
| 5 minutes | 9:35 ET |
Earliest entries, tightest stops, most false breaks |
| 15 minutes | 9:45 ET |
A middle ground; the version we walk through below |
| 30 minutes | 10:00 ET |
Fewer signals, wider stops |
None of these is "the right one". They are different strategies, and each needs its own test.
The rules, as a checklist
A common written version, on 1-minute bars:
- Range: the high and low from
9:30to9:45ET. - Entry: the first 1-minute bar after
9:45that closes outside the range. A wick through the line is not a break. - Stop: the other side of the range.
- Target:
2 ×the range, measured from the side price broke out of. - One trade a day, and a fixed time exit if neither stop nor target is reached.
- Size: contracts = money allowed per trade ÷ (stop in points × point value), rounded down.
Rule 6 is the one most tutorials skip. It is also the one that decides whether the strategy fits a prop account.
A worked example on a real MNQ morning
Real chart, past session, selected to show the rules (not a typical result). MNQ1!, 1-minute, 18 September 2026; chart: TradingView snapshot, levels and labels marked by Tarrow Futures.
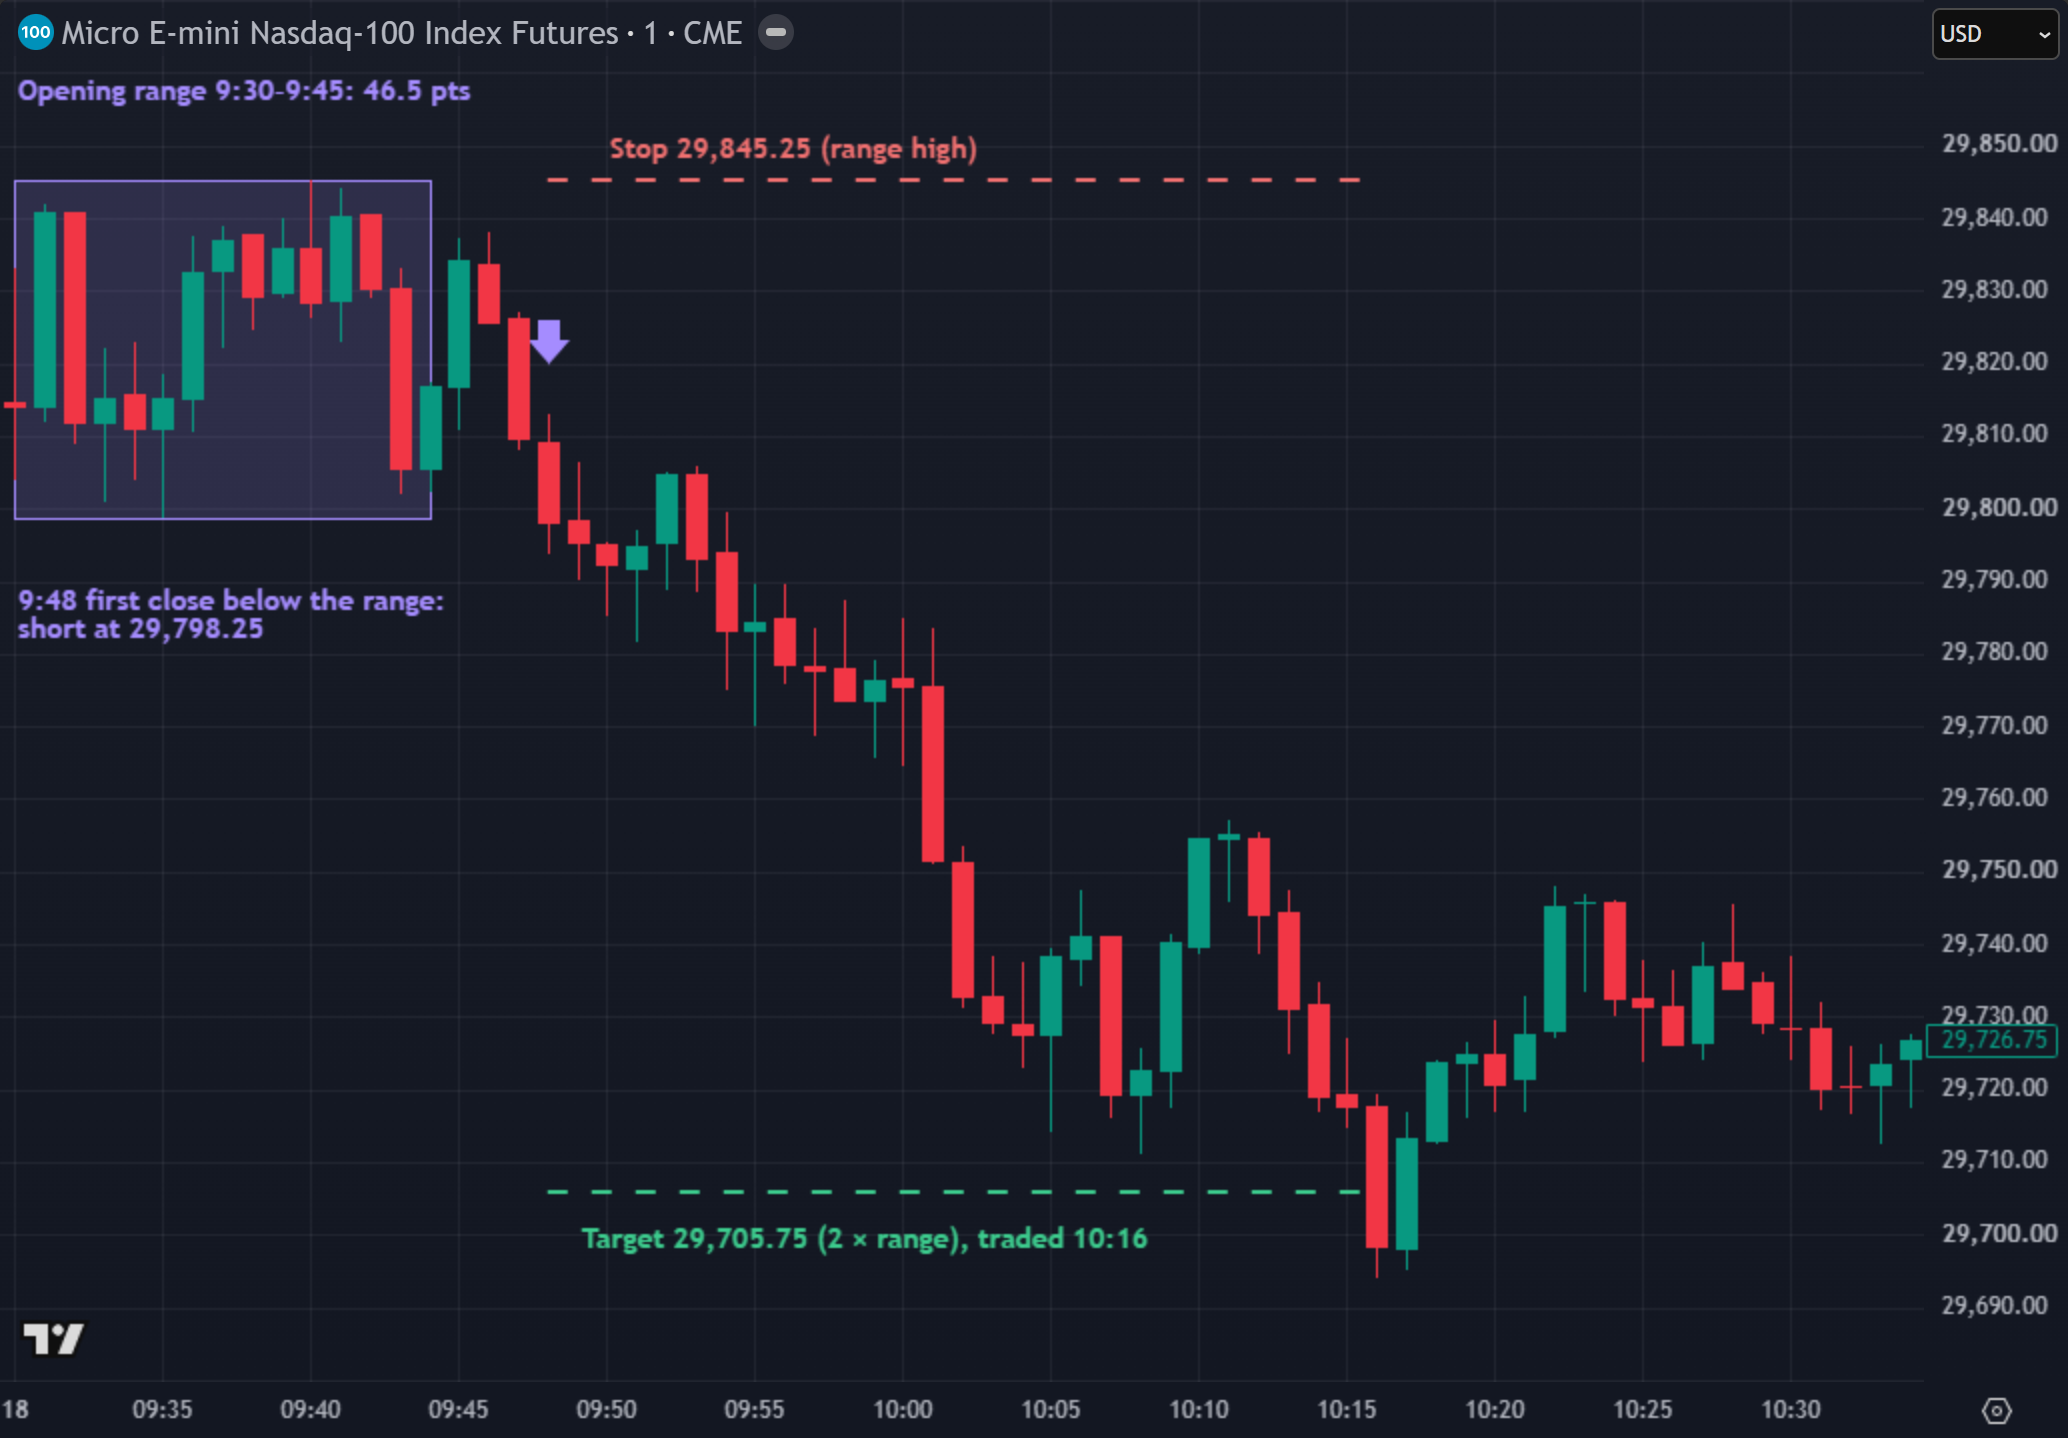
- The range from
9:30to9:45ET ran from29,798.75to29,845.25:46.5points. - At
9:48a bar closed below the range at29,798.25. That close is the entry (short). - The stop sits at the range high,
29,845.25:47points of risk. - The target is the range low minus
2 × 46.5,29,705.75:92.5points away. It traded at10:16.
MNQ is $2 a point (CME Group contract specs), so per micro contract that is 47 × $2 = $94 of risk and 92.5 × $2 = $185 of target, before commissions and slippage. That is what the written rules would have done on that morning. It is not a trade we placed, and other mornings went differently, including the one in the next section.
Why the range size is your risk
On another real MNQ morning, 25 September 2026 (also selected to show the rules, not a typical result), the same 15-minute range was 123 points wide, and the same rules stopped out. The stop was 127.25 points from the entry, or $254.50 per micro: about 2.7 times the risk of 18 September with exactly the same rules.
Here is what that does to a trader who uses the same size every day:
| 18 Sep | 25 Sep | |
|---|---|---|
| Stop distance | 47 pts |
127.25 pts |
| Risk per MNQ | $94 |
$254.50 |
Risk at a fixed 5 MNQ |
$470 |
$1,272.50 |
MNQ from a $470 budget |
5 |
1 |
At a fixed 5 contracts, one losing trade on the 25th is more than a $1,000 daily loss limit (example limit). Sized from the stop with the same $470 budget, it is one contract and a $254.50 loss. The full breakdown walks through that failed morning on the chart.
Hypothetical results. The outcomes above are what the written rules would have done on selected past sessions, before commissions and slippage; they are not trades anyone placed. CFTC Rule 4.41: hypothetical or simulated performance results have certain limitations. Unlike an actual performance record, simulated results do not represent actual trading. Also, since the trades have not been executed, the results may have under- or over-compensated for the impact, if any, of certain market factors, such as lack of liquidity. Simulated trading programs in general are also subject to the fact that they are designed with the benefit of hindsight. No representation is being made that any account will or is likely to achieve profit or losses similar to those shown.
How the ORB fits prop firm rules
Three rules decide whether an ORB survives an evaluation, whatever its backtest says:
- Daily loss limit. Decide how many stops you want to survive, divide your daily budget by that, then divide by the cost of one stop. The position size calculator does this for your own numbers.
- Trailing drawdown. Under an intraday trailing drawdown, open profit lifts the floor. A trade that runs well into profit and then stops out costs room twice: the floor went up and the balance came down. Example figures, not results: at
5MNQ, two targets, one trade that peaks at+$800open and stops out, and two more stops finish+$440, yet end$210under a$2,000trailing floor. - Consistency. ORB days are lumpy, and a consistency rule may cap your best day as a share of total profit. Under a 50% rule (example), a
$925best day needs$1,850of total profit before it fits.
Common mistakes
- Entering on the touch, not the close. The intrabar poke through the range high and the close above it are different signals with different results.
- Fixed size, variable range. The range moves your risk every day unless the size moves the other way.
- Testing without costs. Breakouts fill in fast markets. Add commission both ways and slippage on every fill; a late fill is never better than the backtest price.
- Adding a filter from a handful of days. If it was not tested on many sessions, it is a story, not a filter.
Test it before you trade it
Write the rules so two people would code them the same way, backtest them on your contract over many sessions with costs, run your size through your firm's daily limit and trailing drawdown, then forward-test on a simulator. Our free guide, Build It, Break It, Then Trade It, walks through each step.
The full ORB breakdown has the rule card, both real MNQ mornings step by step (the target and the stop), and the prop-rule arithmetic in one place. It is free with your email, below.
Charts are TradingView snapshots of past sessions; the levels and labels on them were added by Tarrow Futures. Trade outcomes shown are hypothetical; see the CFTC Rule 4.41 notice after the examples above.
Free strategy breakdown · free with your email
Opening range breakout breakdown
The rule card, two real MNQ sessions (one target, one stop) and how to size it under a trailing drawdown. We email you the link, so it is one tap away next time.
✓ It's yours. The link is on its way to your inbox. Open the opening range breakout breakdown now
Read the free overview firstQuestions
What is the opening range in trading?
The high and low of the first few minutes after the market opens. For US index futures most traders use the 9:30 ET cash open and a window of 5, 15 or 30 minutes.
How does the opening range breakout strategy work?
You mark the opening range, then enter when a bar closes outside it, in the direction of the break. The stop usually goes on the other side of the range and the exit is a multiple of the range, a multiple of the risk, or a set time of day.
Which is better, a 5-minute or a 15-minute opening range?
Neither is better in general. A shorter range gives earlier, tighter entries and more false breaks; a longer one gives fewer signals with wider stops. Test both on your own contract, with costs, before choosing.
How profitable is the opening range breakout strategy?
There is no single answer, and anyone quoting one is quoting a particular version, market and period. Results depend on the range window, the stop, the target, costs and the days tested. Backtest your exact rules with commissions and slippage, then forward-test them.
How many contracts should I trade on an opening range breakout?
Size from the stop, not the account. Contracts = the money you allow per trade ÷ (stop distance in points × the contract's point value), rounded down. Because the range changes every day, so does the contract count.
Educational material only. Not financial, investment or trading advice, and not a recommendation to trade any contract or size. Prop firm rules differ and change; the current rulebook of the firm you use decides. Worked examples use example figures, not results. Futures trading involves substantial risk of loss. Evaluations are paid tests and most people who take one do not pass.