Home / Blog / Strategy Testing & Automation
Strategy Testing & Automation
What is a VWAP pullback strategy?
A VWAP pullback strategy trades with a trend that is already under way. When price has stayed on one side of VWAP (the volume-weighted average price since the open) and VWAP itself is sloping the same way, the strategy waits for price to pull back toward VWAP, then enters on the first close back in the trend's direction, with the stop beyond the pullback and a target that is a multiple of the risk.
It is the opposite of the VWAP fade, which bets on a stretched price snapping back to VWAP. On a trend day, the fade stands in front of the trend; the pullback waits for the trend to come back to it. Below: what VWAP is, the rules as numbers, two real MNQ days (a green one and a red one), and why a trade cap is part of the strategy if you trade under a daily loss limit and trailing drawdown.
What VWAP measures
VWAP since the anchor = Σ(price × volume) ÷ Σ(volume). Every trade counts in proportion to its size, so VWAP sits where most of the day's volume has changed hands. Intraday traders anchor it to the 9:30 ET cash open and draw bands 1 and 2 volume-weighted standard deviations (σ) either side.
Two practical points before any test:
- Anchor. A VWAP anchored at the futures session open (6:00 PM ET the evening before) is a different line from one anchored at
9:30ET. - Platform. Platforms differ in how they count volume and compute bands. Your backtest's VWAP and your chart's VWAP must be the same calculation.
The rules, as a checklist
The version we test, on 1-minute bars:
- VWAP from
9:30ET, with a ±1σ band. - Trend: the last
20closes were all on one side of VWAP, and VWAP has moved that way over the last30minutes. - Pullback: price trades back to the 1σ band between price and VWAP (the lower band in a downtrend).
- Entry: within
10bars of the touch, the first close beyond the touch bar, back in the trend's direction. - Stop: the pullback's extreme. Target:
2 ×the risk. - Window:
10:00to14:30ET. Cap:2trades a day.
Every number in that list is a choice. Change the look-back from 20 closes to 10 and you have a different strategy that needs its own test.
A real green day
Real chart, past session, selected to show the rules (not a typical result). MNQ1!, 1-minute, 5 August 2026; chart: TradingView snapshot, levels and labels marked by Tarrow Futures. MNQ is $2 a point (CME Group), and the example uses 3 MNQ, so each point is $6.
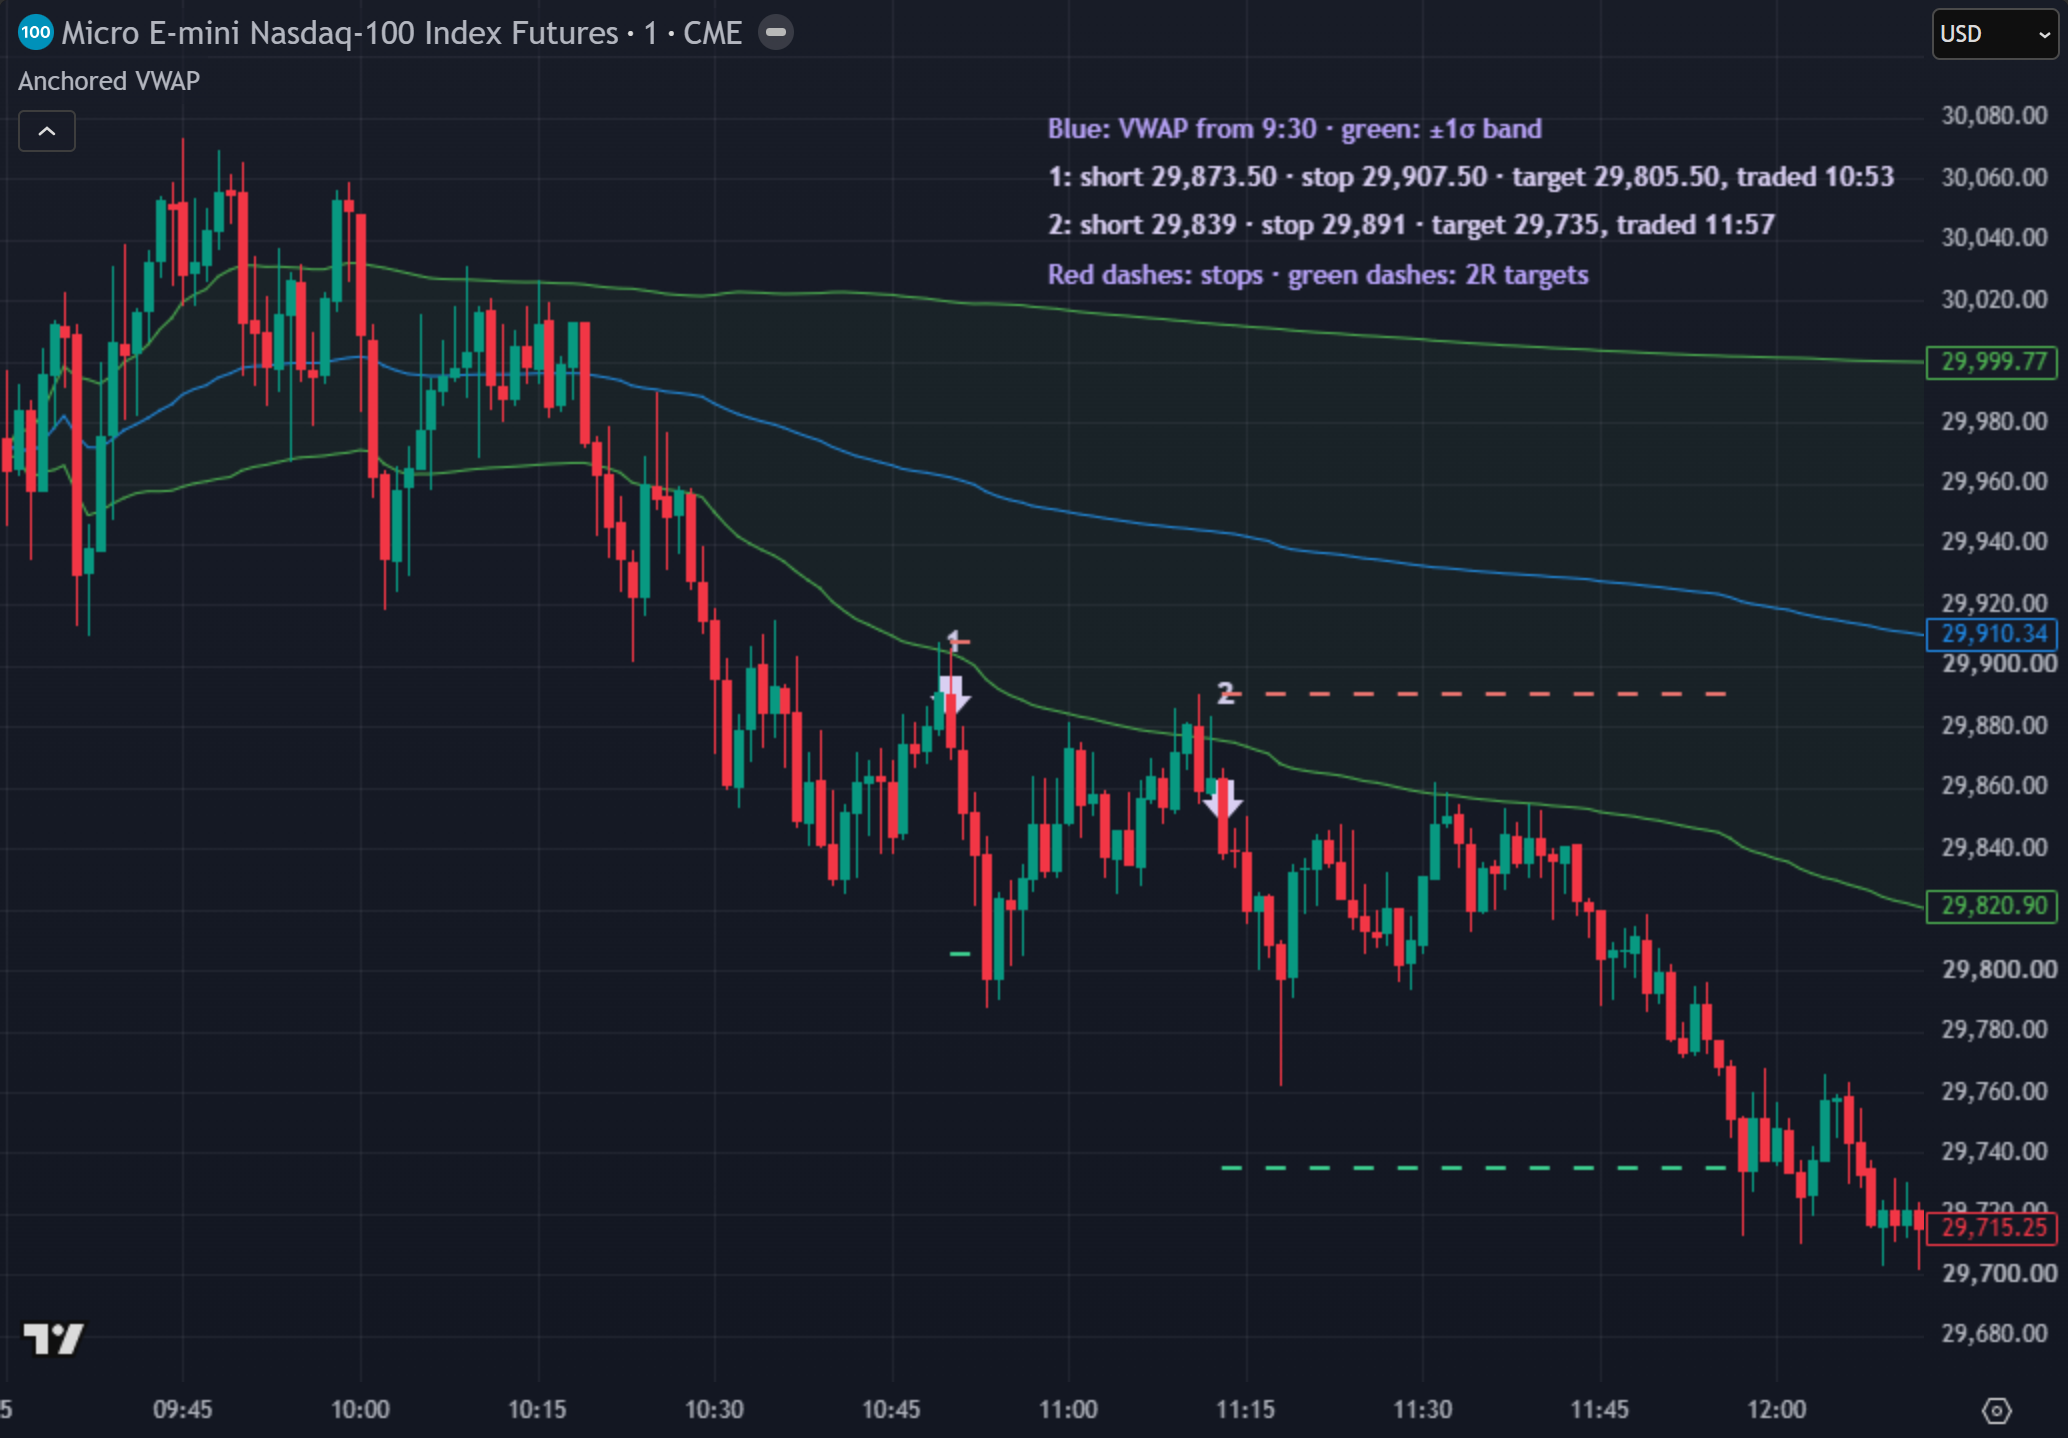
| Trade | Entry (ET) | Risk | Result |
|---|---|---|---|
| 1, short | 10:50 |
34 pts |
2R reached at 10:53: 68 × $6 = +$408 |
| 2, short | 11:13 |
52 pts |
2R reached at 11:57: 104 × $6 = +$624 |
| Day | +$1,032 before costs |
Price spent the morning below a falling VWAP. Each rally to the band was followed by a close back down, which gave the entry and put the stop just above that rally's high. After two trades the cap ended the day.
Free strategy breakdownSee it on real charts: the vwap pullback breakdown has the rule card, a day it worked and a day it failed.Get it ↓A real red day, and why the cap matters
Real past session, selected to show the rules (not a typical result); its chart is in the full breakdown. MNQ1!, 1-minute, 25 September 2026. The trend filter was true again, but the down-move gave way:
| Trade | Entry (ET) | Risk | Result |
|---|---|---|---|
| 1, short | 10:29 |
48 pts |
stopped at 10:34: −$288 |
| 2, short | 10:41 |
52.5 pts |
stopped at 10:55: −$315 |
| Day | −$603 before costs |
Without the cap, the next signal is a third entry into a market that has stopped trending. With it, the worst case was known before the open: about 2 × 52.5 × $6 ≈ $630, inside a $1,000 daily loss limit (example limit). In our small sample we found no filter that reliably told the green days from the red ones in advance, so we don't offer one. Test any filter before trusting it.
Hypothetical results. The outcomes above are what the written rules would have done on selected past sessions, before commissions and slippage; they are not trades anyone placed. CFTC Rule 4.41: hypothetical or simulated performance results have certain limitations. Unlike an actual performance record, simulated results do not represent actual trading. Also, since the trades have not been executed, the results may have under- or over-compensated for the impact, if any, of certain market factors, such as lack of liquidity. Simulated trading programs in general are also subject to the fact that they are designed with the benefit of hindsight. No representation is being made that any account will or is likely to achieve profit or losses similar to those shown.
How it fits prop firm rules
- Daily loss limit. Work backwards: limit ÷ trade cap = budget per trade; budget ÷ (stop × point value) = contracts. Example:
$1,000 ÷ 2 = $500; a52.5-point stop costs$105a micro, so4MNQ. The position size calculator does this for your numbers. - Trailing drawdown. Under an intraday trailing drawdown, a trade that nears its target and reverses to the stop costs room twice. Example figures: at
3MNQ, a trade that reaches+$540open from a balance high and then stops out for−$312shrinks your room by$852. - Consistency. A two-target day is a big day. Under a 50% rule (example), a
$1,032best day needs$2,064of total profit before it fits; the consistency rule checker shows where your target moves.
Common mistakes
- Fading instead of following. Selling a rally in an uptrend because it is "far from VWAP" is a different strategy with different results.
- No trade cap. The trend filter can stay true for hours. Decide the cap before the open.
- Mismatched VWAP. A backtest on one VWAP calculation and live trading on another are two strategies.
- Testing without costs. Pullback entries often fill on a fast bar. Model slippage on every fill; a late fill is never better.
Test it before you trade it
Pin down every number, check your platform's VWAP matches your test, backtest on many sessions with costs, count the worst run of red days against your trailing drawdown, then forward-test on a simulator. Our free guide, Build It, Break It, Then Trade It, shows how.
The full VWAP pullback breakdown has the rule card, both real MNQ days on the chart, step by step, and the prop-rule arithmetic. It is free with your email, below.
Charts are TradingView snapshots of past sessions; the levels and labels on them were added by Tarrow Futures. Trade outcomes shown are hypothetical; see the CFTC Rule 4.41 notice after the examples above.
Free strategy breakdown · free with your email
VWAP pullback breakdown
The rule card, a real green day and a real red day on MNQ, and the two-trade cap that kept the red day small. We email you the link, so it is one tap away next time.
✓ It's yours. The link is on its way to your inbox. Open the vwap pullback breakdown now
Read the free overview firstQuestions
What is VWAP?
The volume-weighted average price since an anchor, usually the session open. It is the sum of price × volume for every trade divided by total volume, so prices where more contracts traded count for more.
How does a VWAP pullback strategy work?
When price has stayed on one side of VWAP and VWAP is sloping the same way, you wait for price to pull back toward VWAP or a band near it, then enter on the first close back in the trend's direction. The stop goes beyond the pullback and the target is a multiple of that risk.
What is the difference between a VWAP pullback and a VWAP fade?
A fade bets that a stretched price snaps back to VWAP, trading against the move. A pullback trades with the trend after price has come back toward VWAP. On a trend day they take opposite sides.
Does the VWAP pullback strategy work?
It depends on the exact rules, the market, the days tested and costs. In our own small test on recorded MNQ sessions, a fade version rarely reached its target, so we teach the pullback version as a worked example of the rules; that is not evidence it is profitable. Test any version, with costs, before trusting it.
Which VWAP settings should I use?
Most intraday futures traders anchor VWAP to the 9:30 ET cash open and use bands of 1 and 2 volume-weighted standard deviations. Whatever you choose, make sure your platform calculates it the same way as your backtest.
Educational material only. Not financial, investment or trading advice, and not a recommendation to trade any contract or size. Prop firm rules differ and change; the current rulebook of the firm you use decides. Worked examples use example figures, not results. Futures trading involves substantial risk of loss. Evaluations are paid tests and most people who take one do not pass.