Home / Blog / Strategy Testing & Automation
Strategy Testing & Automation
What is a VWAP mean reversion strategy?
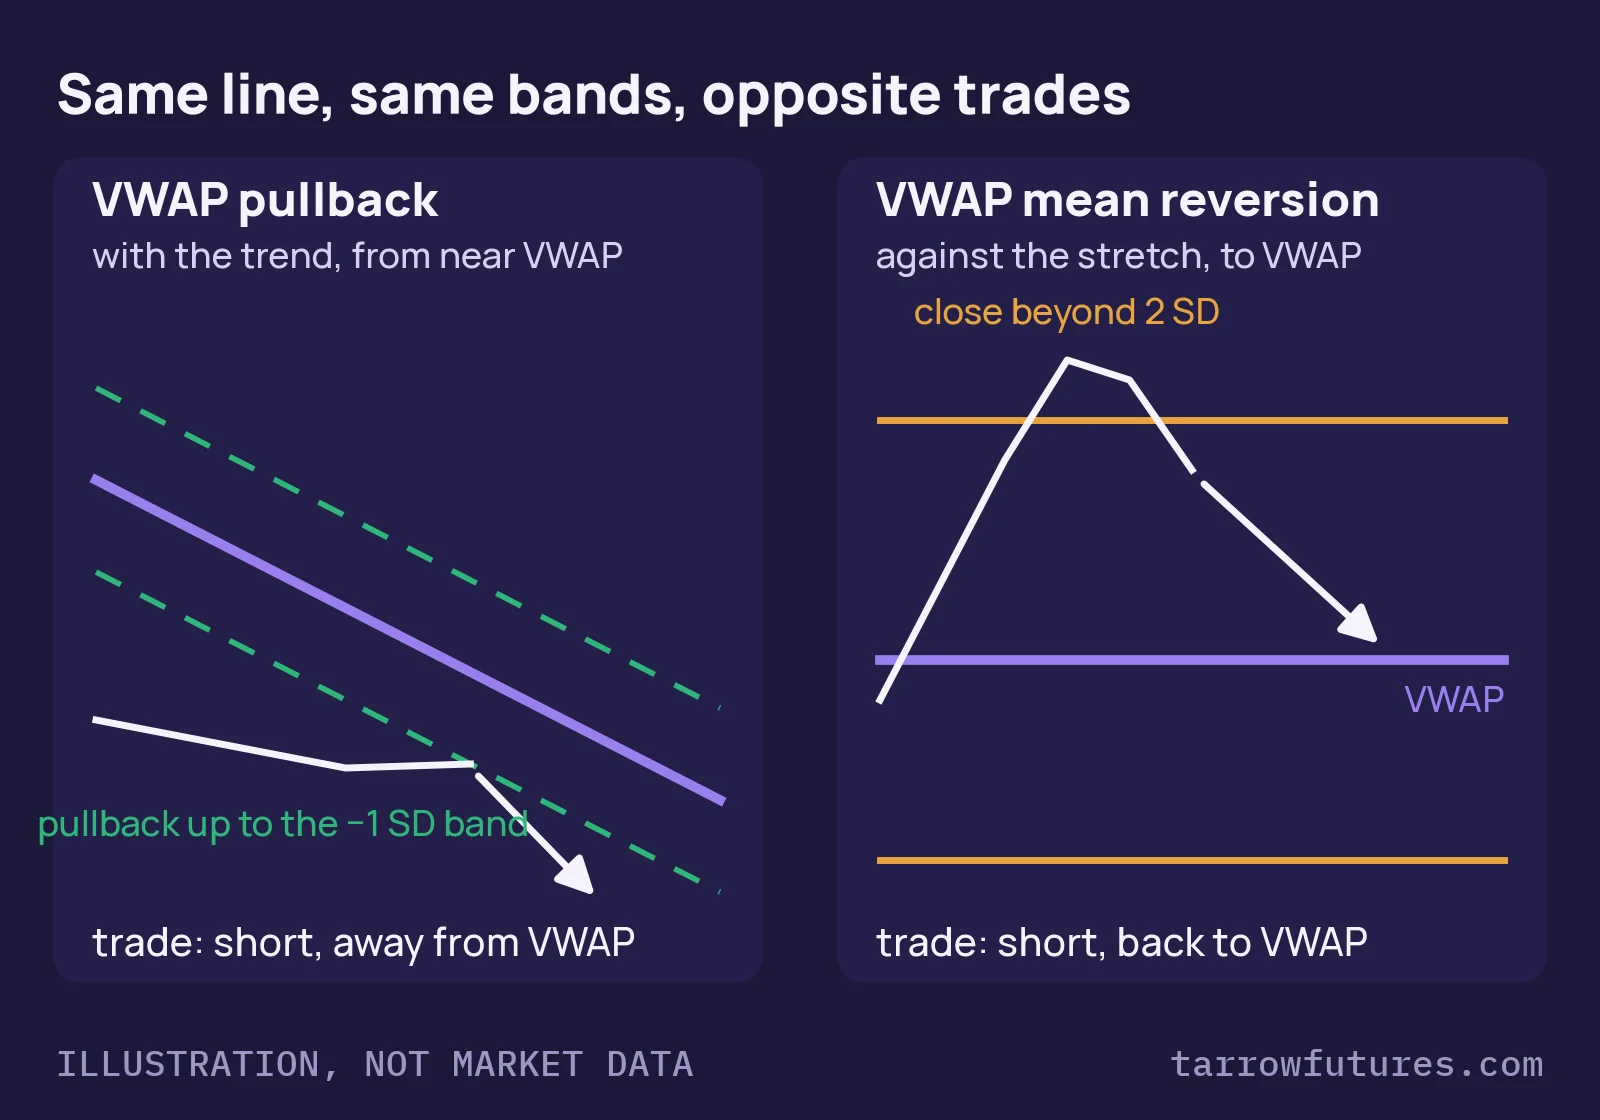
A VWAP mean reversion strategy bets that when price stretches unusually far from VWAP (the volume-weighted average price since the open), it is more likely to come back toward VWAP than to keep going. The stretch is measured with standard-deviation bands around VWAP, most often 2 standard deviations (2σ); the trade goes against the last move, with the stop beyond the stretch and VWAP as the target.
It is the opposite bet to the VWAP pullback. The pullback trades with a trend after price comes back near VWAP; mean reversion trades against a run after price has gone far from it. Below: what the bands measure, the rules as numbers, a real session that reached VWAP and a real session that failed, and how to keep a trend day from ending a prop account with a trailing drawdown.
Free strategy breakdown · free with your email
VWAP mean reversion breakdown
The rule card, a real session it reached VWAP and one it stopped out, and the rule that kept the trend day to one loss.
✓ It's yours. The link is on its way to your inbox. Open the vwap mean reversion breakdown now
Read the free overview firstWhat VWAP's standard-deviation bands measure
VWAP since the anchor = Σ(price × volume) ÷ Σ(volume), usually anchored to the 9:30 ET cash open. The bands sit k volume-weighted standard deviations (σ) either side: how spread out today's traded prices are around VWAP, weighted by volume.
- A close beyond
2σmeans price is unusually far from where most of today's volume traded. It does not mean "too far": the bands widen as the day spreads out, and on a trend day price can ride outside them. - Platforms differ in anchor time, the price used (close or typical price) and the band formula. Your backtest's bands and your chart's bands must be the same calculation.
VWAP mean reversion vs VWAP pullback
| VWAP pullback | VWAP mean reversion | |
|---|---|---|
| Bet | The trend continues | The stretch snaps back |
| Price at entry | Near VWAP | Far from VWAP |
| Direction | With the trend | Against the last move |
| Target | A multiple of the risk | VWAP |
| The day it fears | A trend that gives way | A trend day |
The rules, as a checklist
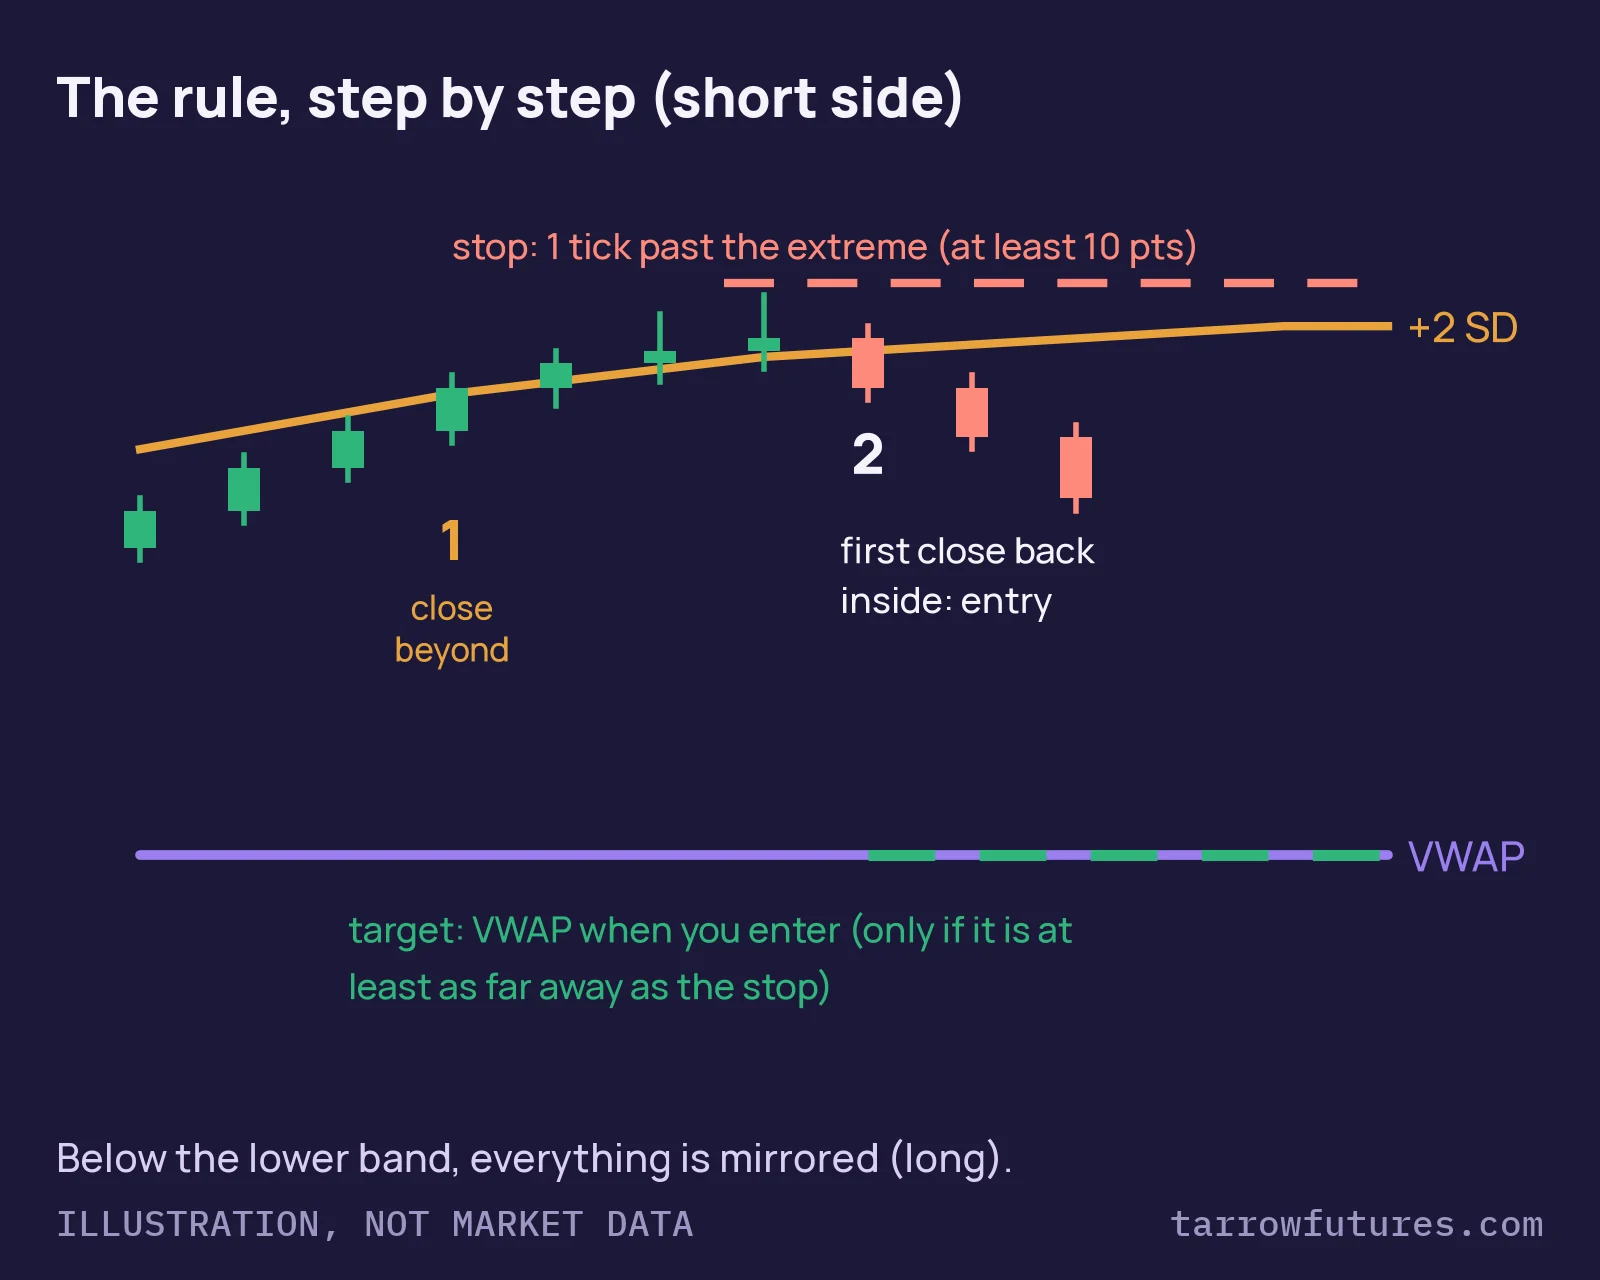
On 1-minute MNQ bars:
- VWAP from
9:30ET on the typical price, with ±1σ and ±2σ bands (TradingView: the built-in Anchored VWAP on the 9:30 bar). - Window: new signals
10:00to14:29ET only. - Stretch: a bar closes beyond the 2σ band.
- Entry: the first close back inside the band, toward VWAP.
- Stop: one tick beyond the stretch's extreme, never closer than
10points. Target: VWAP at the entry bar, and only if it is at least as far as the stop. - Cap:
2trades a day; after a stop on one side, that side is done for the day. Flat by15:50.
This is the common 2σ version, taught as a worked example of the rules; that is not evidence it is profitable.
A session where the rules reached VWAP
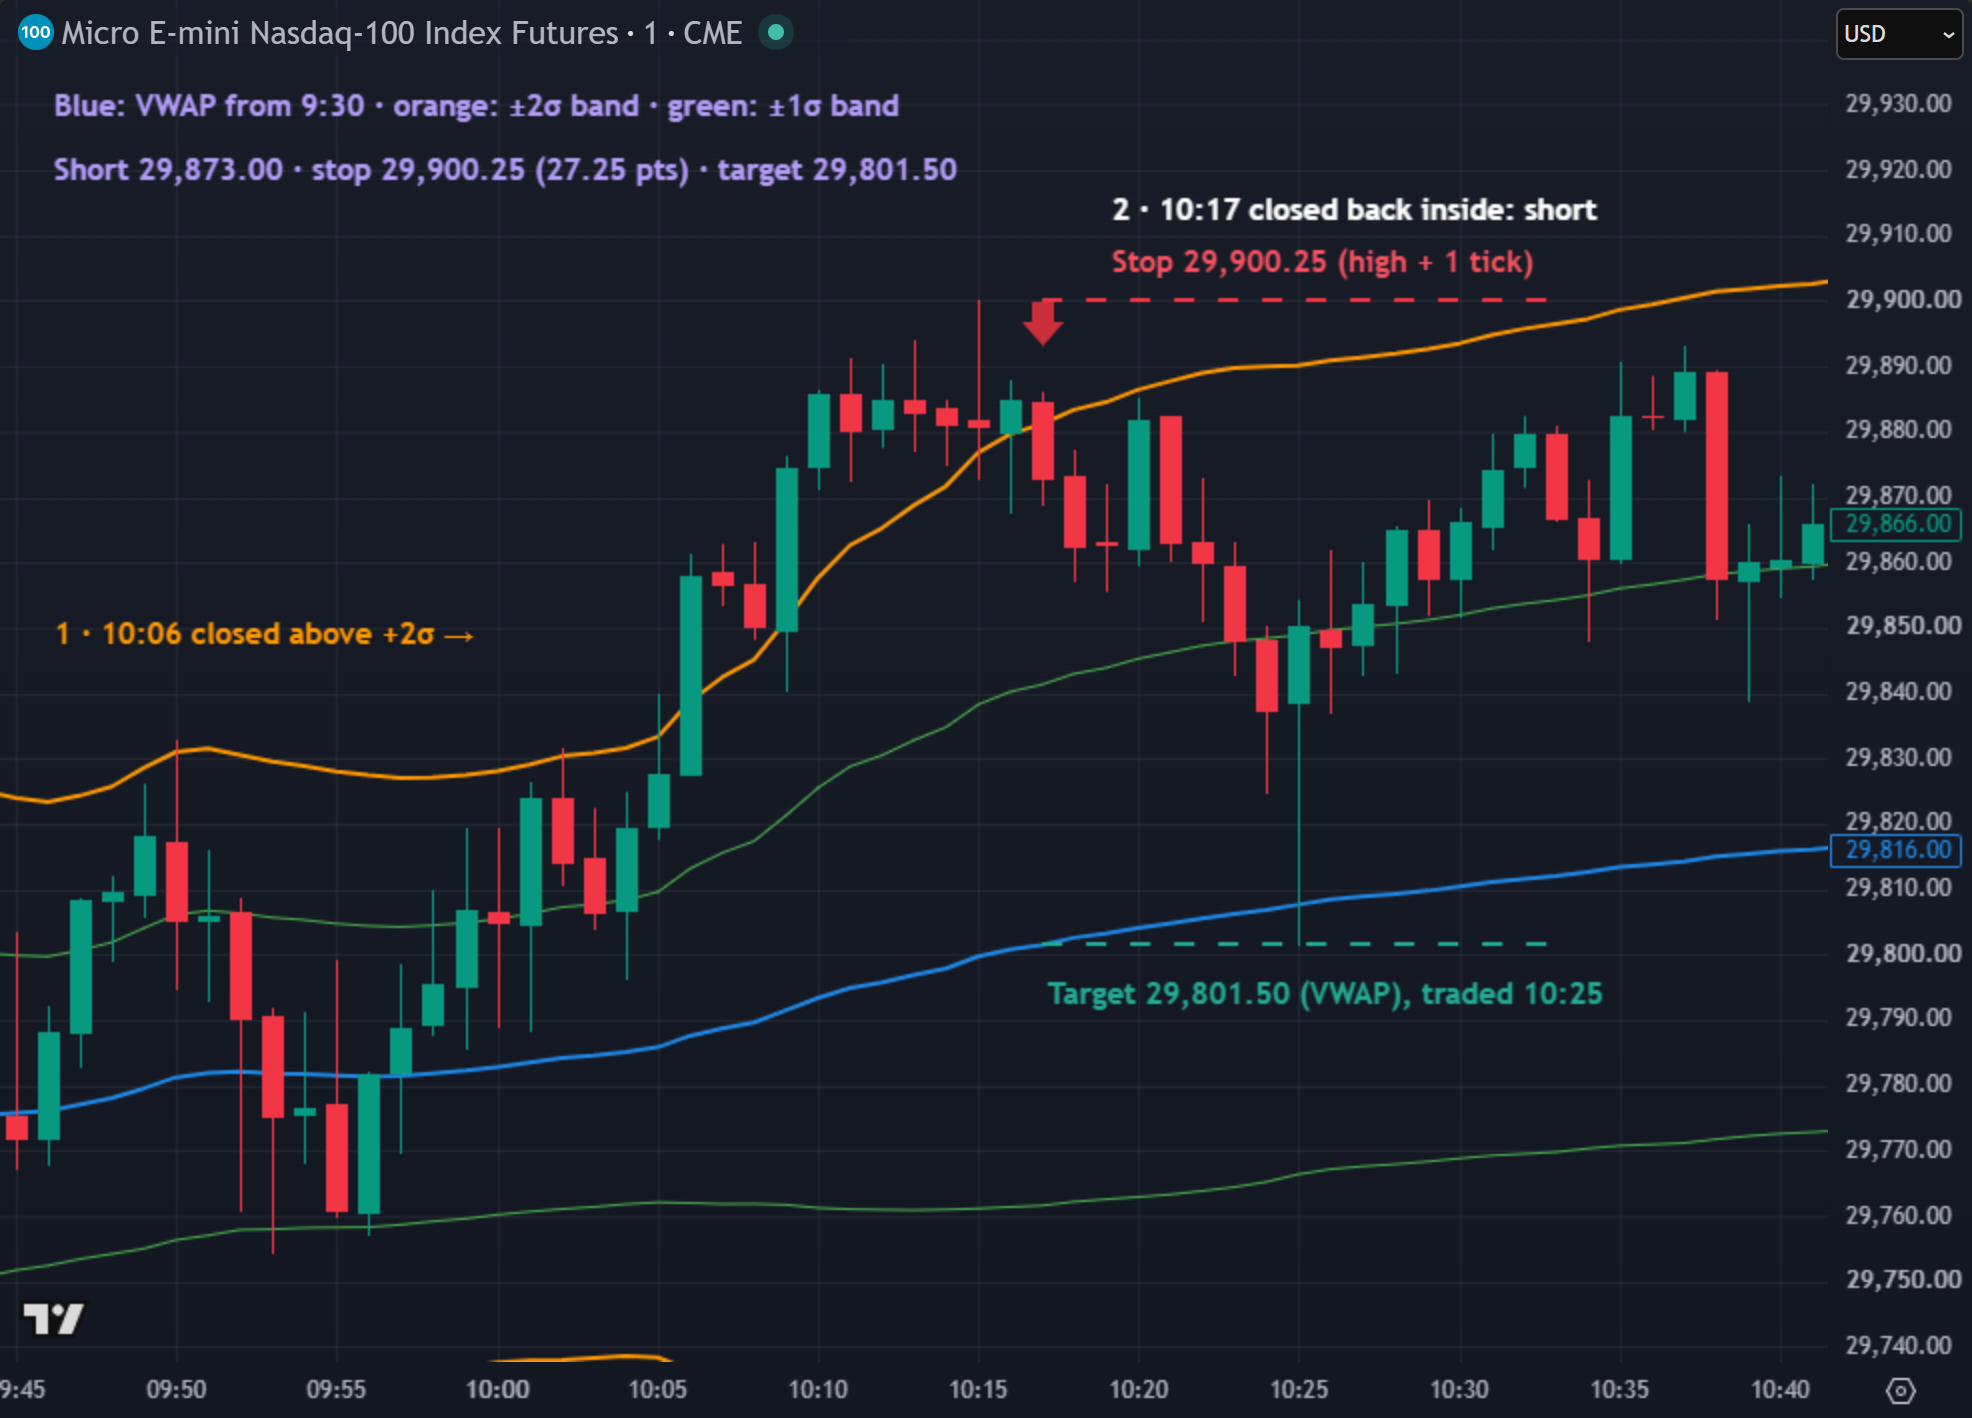
Past session, selected to show the rules, not a typical result. MNQ1!, 1-minute, 10 August 2026; chart: TradingView snapshot, levels and labels marked by Tarrow Futures. MNQ is $2 a point (CME Group contract specs).
| Step | Value |
|---|---|
| Stretch (close above the upper 2σ band) | 10:06, close 29,858.00 |
| Entry, short (first close back inside) | 10:17 at 29,873.00 |
Stop (one tick above the stretch high of 29,900.00) |
29,900.25, 27.25 pts |
| Target (VWAP at entry) | 29,801.50, 71.5 pts |
Size at a $200 example budget, 2-pt cost allowance |
200 ÷ ((27.25 + 2) × 2) = 3.4 → 3 MNQ |
| Outcome | Hypothetical: VWAP traded at 10:25, 71.5 × $2 × 3 = +$429 before costs |
A session where the same rules failed
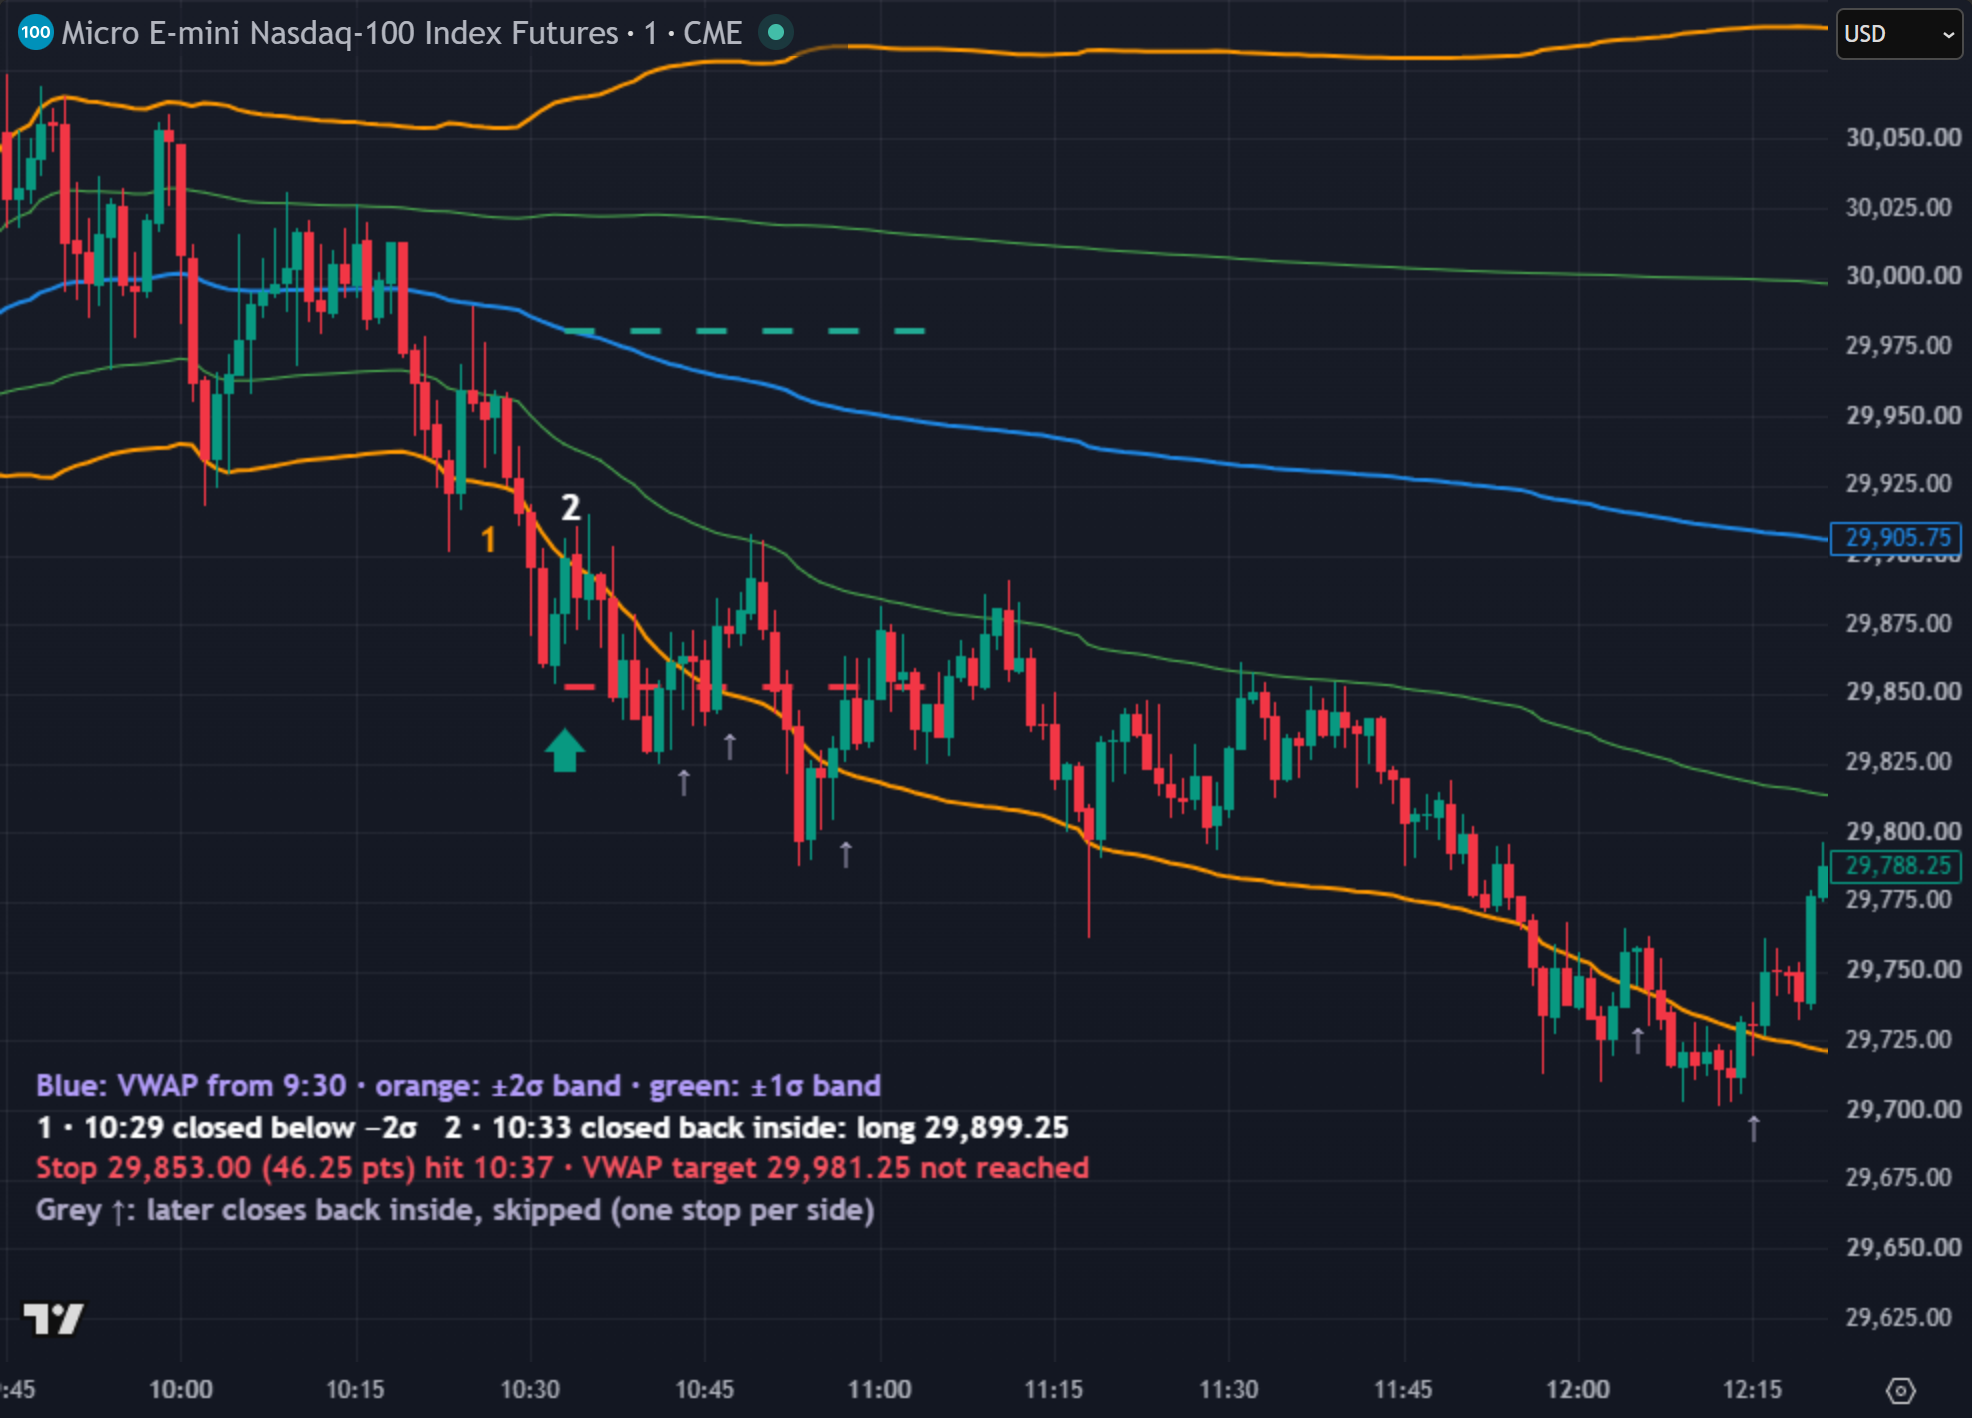
Past session, selected to show the rules, not a typical result. MNQ1!, 1-minute, 5 August 2026; chart: TradingView snapshot, levels and labels marked by Tarrow Futures.
| Step | Value |
|---|---|
| Entry, long (close back inside the lower band, by less than half a point) | 10:33 at 29,899.25 |
| Stop | 29,853.00, 46.25 pts → 2 MNQ at the same budget |
| Outcome | Hypothetical: stopped at 10:37, 46.25 × $2 × 2 = −$185 before costs. Longs were then off for the day |
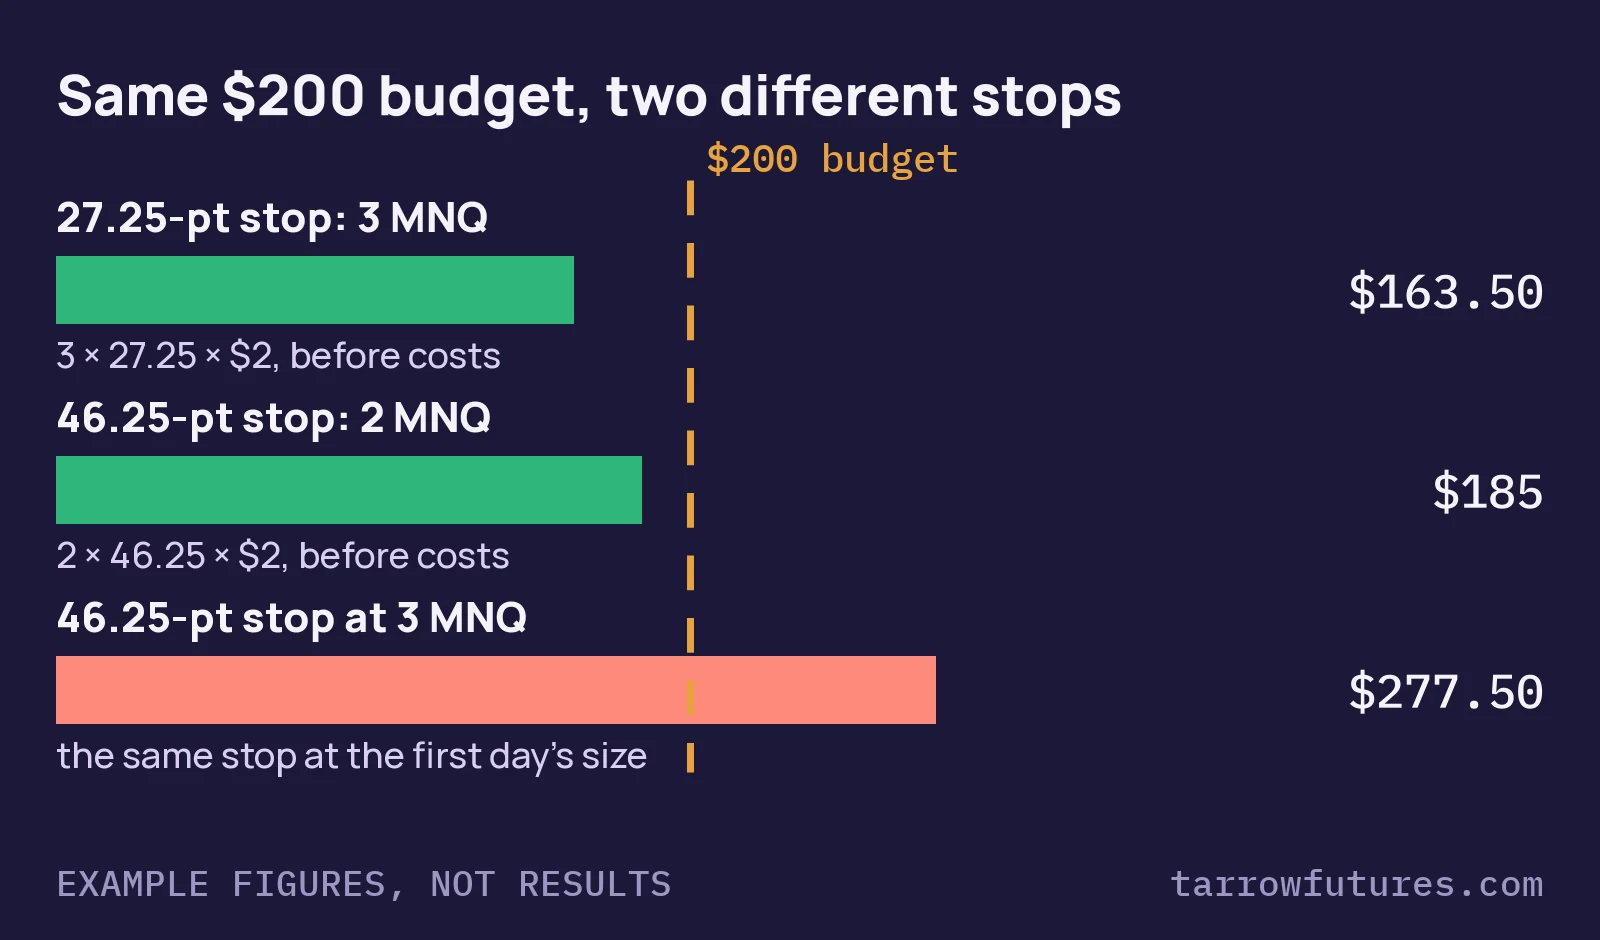
5 August was a trend day under a falling VWAP, the same morning our VWAP pullback example used as its target day. Every new low looked stretched: after the stop, price closed back inside the lower band five more times by 12:14 ET, and the one-stop-per-side rule took none of them. The session closed at 29,606.75. The wider stop also meant fewer contracts, so the loss stayed inside the example budget; at the first session's size of 3, the same stop would have cost $277.50. We don't offer a filter for spotting trend days in advance. Test any filter before trusting it.
Hypothetical results. The outcomes above are what the written rules would have done on selected past sessions, before commissions and slippage; they are not trades anyone placed. CFTC Rule 4.41: hypothetical or simulated performance results have certain limitations. Unlike an actual performance record, simulated results do not represent actual trading. Also, since the trades have not been executed, the results may have under- or over-compensated for the impact, if any, of certain market factors, such as lack of liquidity. Simulated trading programs in general are also subject to the fact that they are designed with the benefit of hindsight. No representation is being made that any account will or is likely to achieve profit or losses similar to those shown.
How it fits prop firm rules
- Daily loss limit. Two trades at a
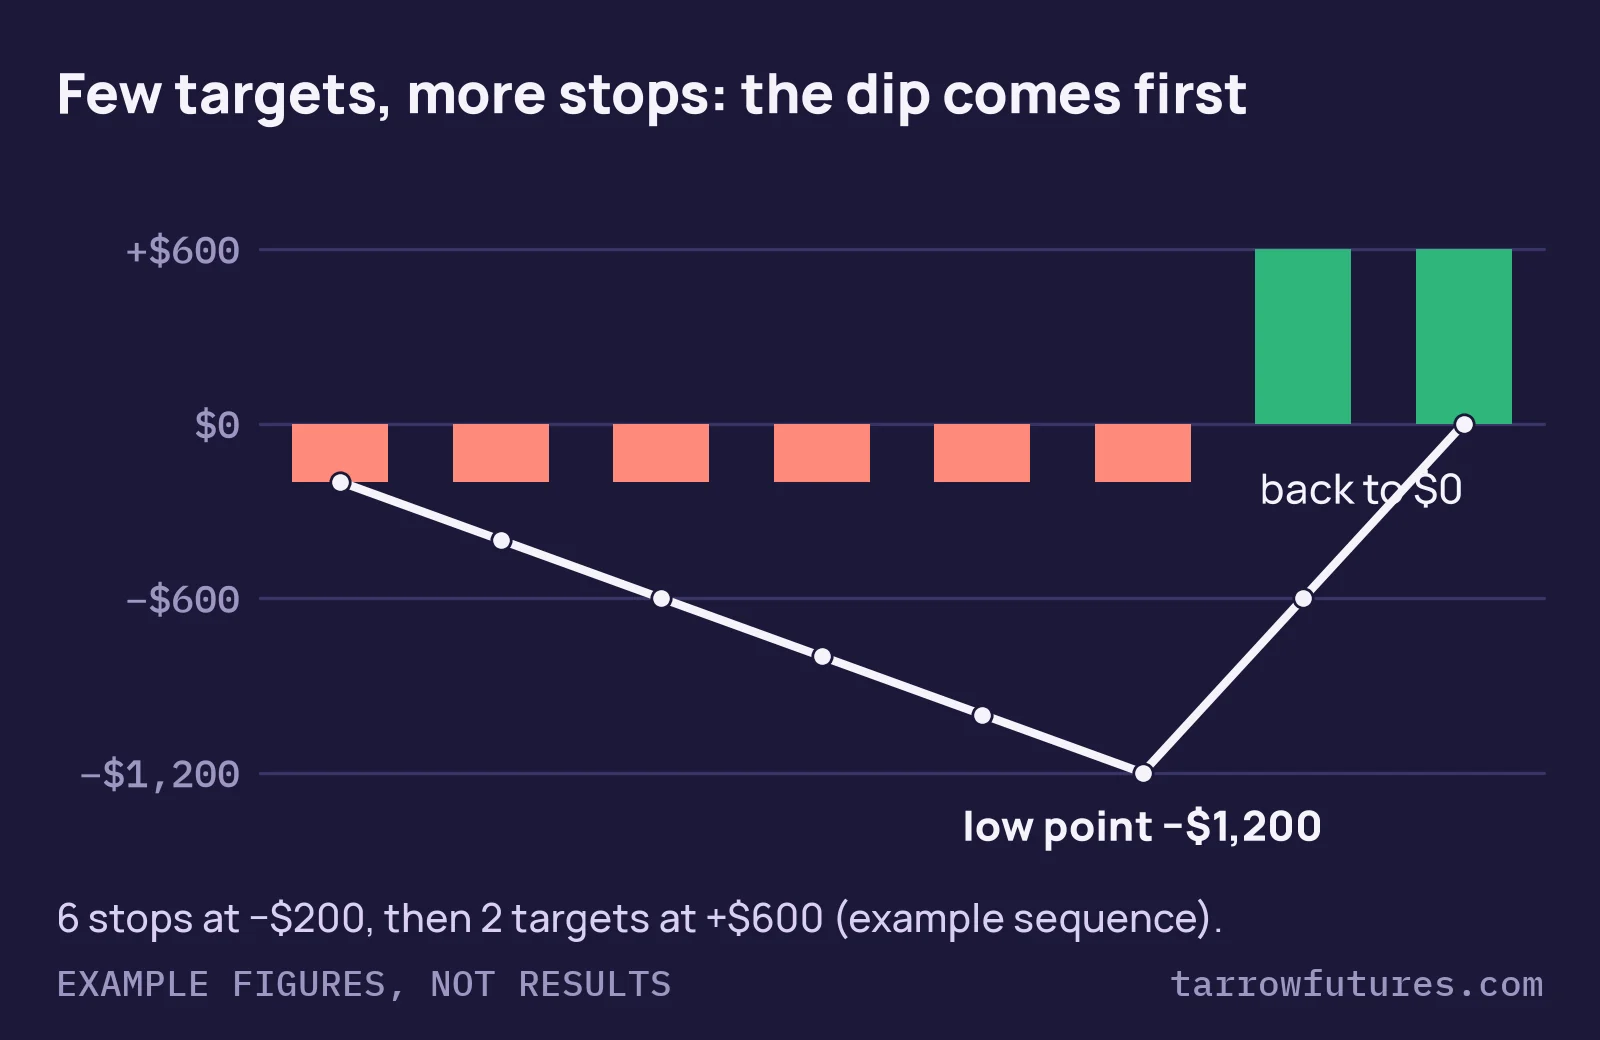
$200example budget is a$400worst day by rule, inside a$1,000example limit. Size each trade from its own stop:$163.50at risk on 3 MNQ with the27.25-point stop,$185on 2 MNQ with the46.25-point stop. The position size calculator does it for your numbers. - Trailing drawdown. A fade with a far target can lose more often than it wins. Example sequence: six stops at
$200(−$1,200) then two targets of+$600(+$1,200) ends flat, after a$1,200dip into a$2,000drawdown. Under an intraday trailing drawdown, open profit on a far target also lifts the floor before a reversal. - Consistency. One target can be most of a week. Under a 50% rule (example), a
$429best day needs$858of total profit; check it with the consistency rule checker.
Common mistakes
- Fading a wick. A wick through the band is not a close beyond it. Waiting for the close, then the close back inside, is what puts the stop beyond an extreme that already exists.
- No side limit. On a trend day, "stretched" keeps getting more stretched. Decide before the open how many times you will fade one direction.
- Moving the target with VWAP. VWAP drifts toward price as the day goes on. Fix the target at entry, or test the moving version separately.
- Changing the band after seeing results. If you try 2σ, then 2.5σ, then 3σ on the same sessions and keep the best, you have learned about those sessions, not about the band.
For how this compares with other strategies under the same prop rules, see futures trading strategies ranked by difficulty.
Test it before you trade it
Fix the band and bar size before the test, check your platform's VWAP matches, run the strongest trend days in your data first, backtest with costs, then forward-test on a simulator. Our free guide, Build It, Break It, Then Trade It, shows how.
The full VWAP mean reversion breakdown has the rule card, both real MNQ sessions step by step, and the prop-rule arithmetic. It is free with your email, below.
Charts are TradingView snapshots of past sessions; the levels and labels on them were added by Tarrow Futures. Trade outcomes shown are hypothetical; see the CFTC Rule 4.41 notice after the examples above. Diagrams labelled as illustrations are drawn by Tarrow Futures and are not market data.
Free strategy breakdown · free with your email
VWAP mean reversion breakdown
The rule card, a real session it reached VWAP and one it stopped out, and the rule that kept the trend day to one loss. We email you the link, so it is one tap away next time.
✓ It's yours. The link is on its way to your inbox. Open the vwap mean reversion breakdown now
Read the free overview firstQuestions
What is VWAP mean reversion?
A strategy that bets price will come back toward VWAP after stretching unusually far from it. The stretch is usually measured with bands a set number of volume-weighted standard deviations either side of VWAP, commonly 2, and the trade goes against the last move with VWAP as the target.
What is the difference between VWAP mean reversion and a VWAP pullback?
Mean reversion enters far from VWAP and trades back toward it, against the move. A pullback waits for a trending market to come back near VWAP and trades with the trend, away from it. They take opposite sides on the same chart, and each fears a different kind of day.
Which standard deviation band should I use for VWAP mean reversion?
Bands at 1, 2 and 3 standard deviations are all common; 2 is the usual choice for a mean reversion entry, and it is the one our worked example uses. It is taught as a worked example of the rules; that is not evidence it is profitable. Whatever band you choose, fix it before you test and do not change it after seeing results.
Does VWAP mean reversion work on trend days?
Trend days are where a fade is most exposed, because price can close beyond the outer band again and again. That is why a cap on trades and a rule that ends a side after one stop are part of the strategy, not extras.
How do I size a VWAP mean reversion trade in a prop account?
From the stop. Contracts = risk per trade divided by ((stop in points + a cost allowance) times the point value), rounded down. MNQ is $2 a point, so with an example $200 budget, a 27.25-point stop and a 2-point allowance that is 3 micros, and a stop wider than 98 points means no trade.
Educational material only. Not financial, investment or trading advice, and not a recommendation to trade any contract or size. Prop firm rules differ and change; the current rulebook of the firm you use decides. Worked examples use example figures, not results. Futures trading involves substantial risk of loss. Evaluations are paid tests and most people who take one do not pass.