Home / Blog / Strategy Testing & Automation
Strategy Testing & Automation
What is the gap fill strategy in futures?
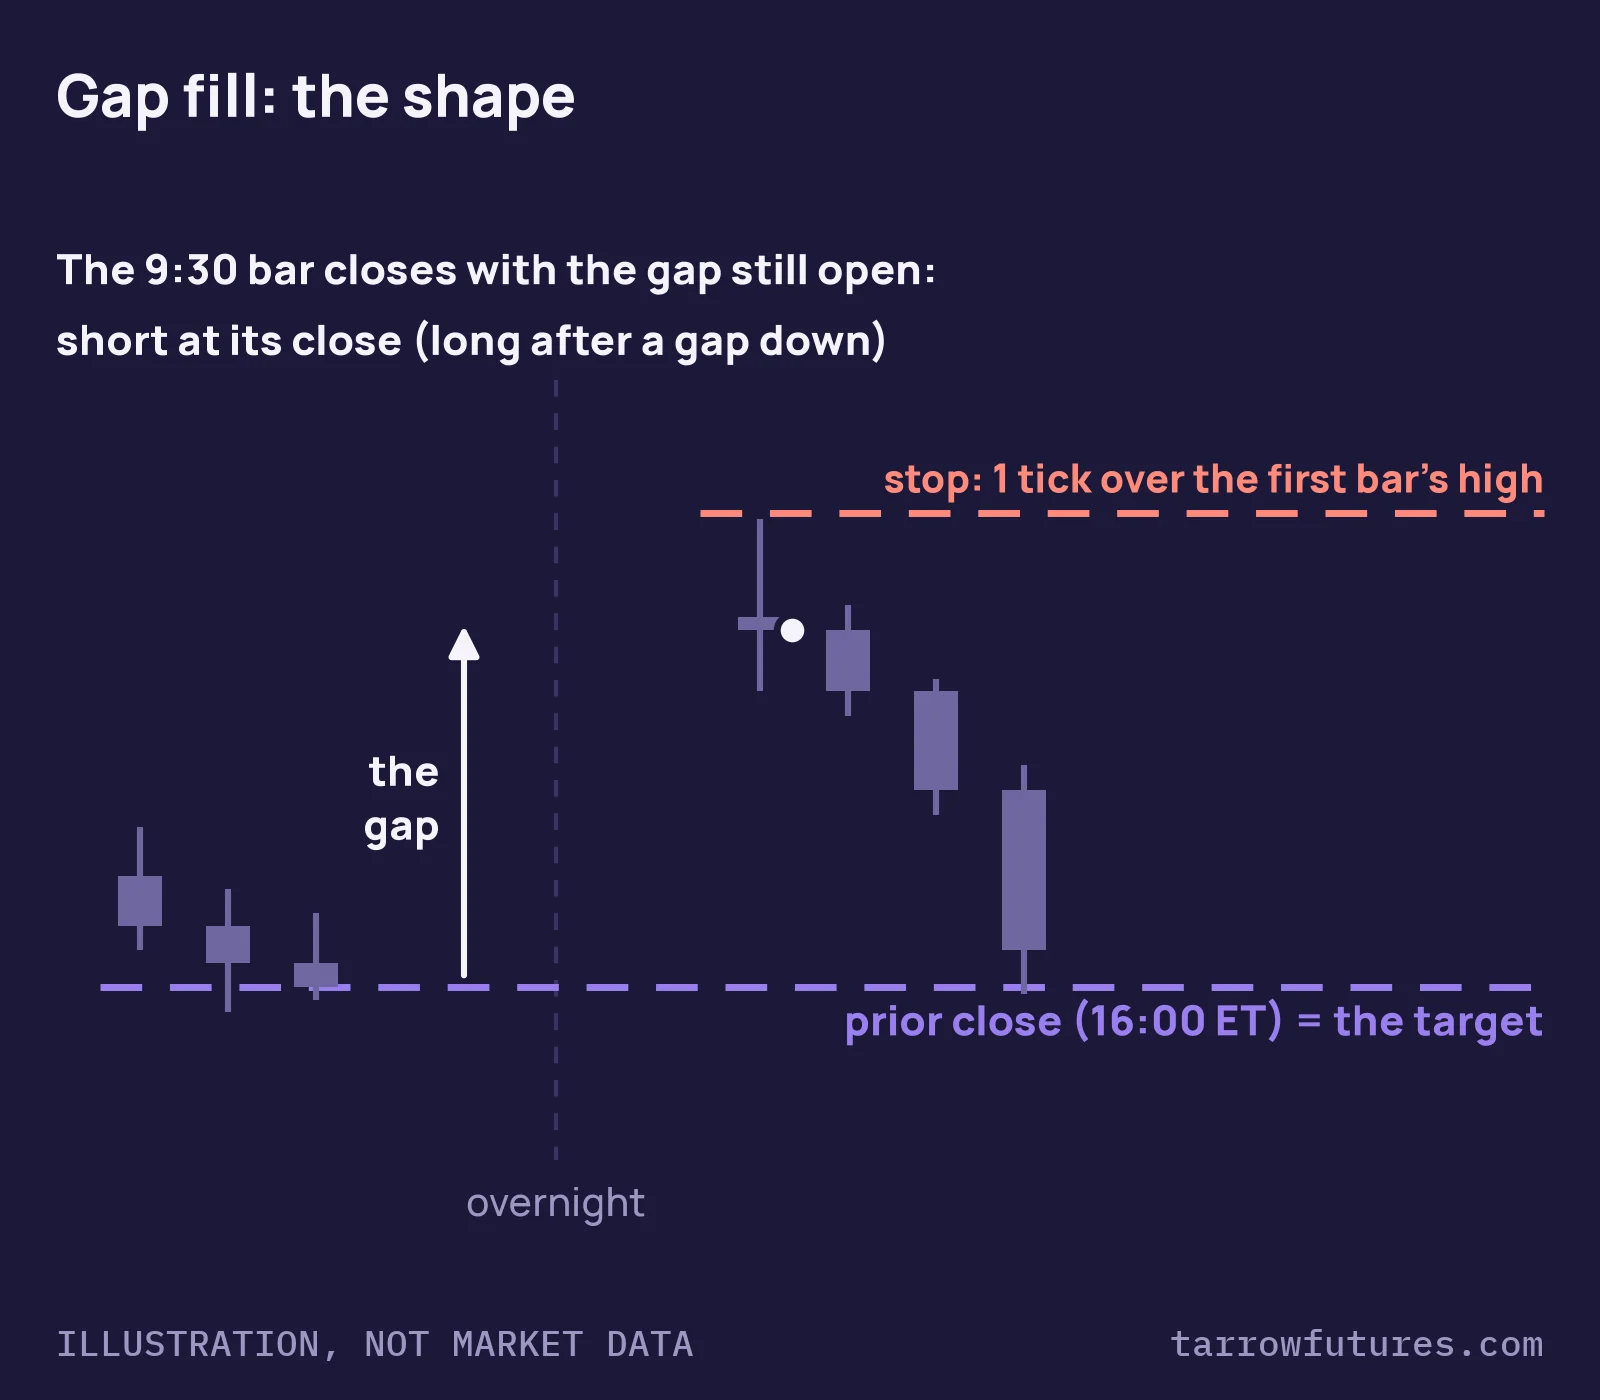
A gap fill strategy trades back toward the prior session's close after the market opens away from it: short after a gap up, long after a gap down, with the prior close as the target. Futures trade overnight, so the gap has to be measured between two fixed times; in the version shown here it is the 9:30 ET open against the prior 16:00 ET close, and the trade is taken at the close of the first 5-minute bar if the gap is still open.
This post defines each rule as a number, walks through two real MNQ sessions (a gap that filled in fifteen minutes and one that never filled), and shows what a stop that changes every day does to a prop account's daily loss limit.
Free strategy breakdown · free with your email
Gap fill breakdown
The rule card, a real MNQ gap that filled in fifteen minutes, and one that never filled.
✓ It's yours. The link is on its way to your inbox. Open the gap fill breakdown now
Read the free overview firstThe gap, defined for futures
Stocks don't trade overnight, so a stock's gap is plain to see. MNQ and NQ trade almost around the clock, so the open of the regular session is just another price in a market that has been trading since the evening before. The gap only means something once you fix two times.
| Term | Meaning on this card |
|---|---|
| Prior close | The close of the prior session's 15:55 ET 5-minute bar, which ends at 16:00 ET |
| Open | The open of today's 9:30 ET bar |
| Gap | Open minus prior close. Positive is a gap up, negative a gap down |
| Fill | Any price trading back to the prior close |
Other definitions are common: the CME settlement price, or the end of the futures day at 17:00 ET. Each one gives a different gap on the same morning. Pick one, write it down and test that one.
The rules, as a checklist
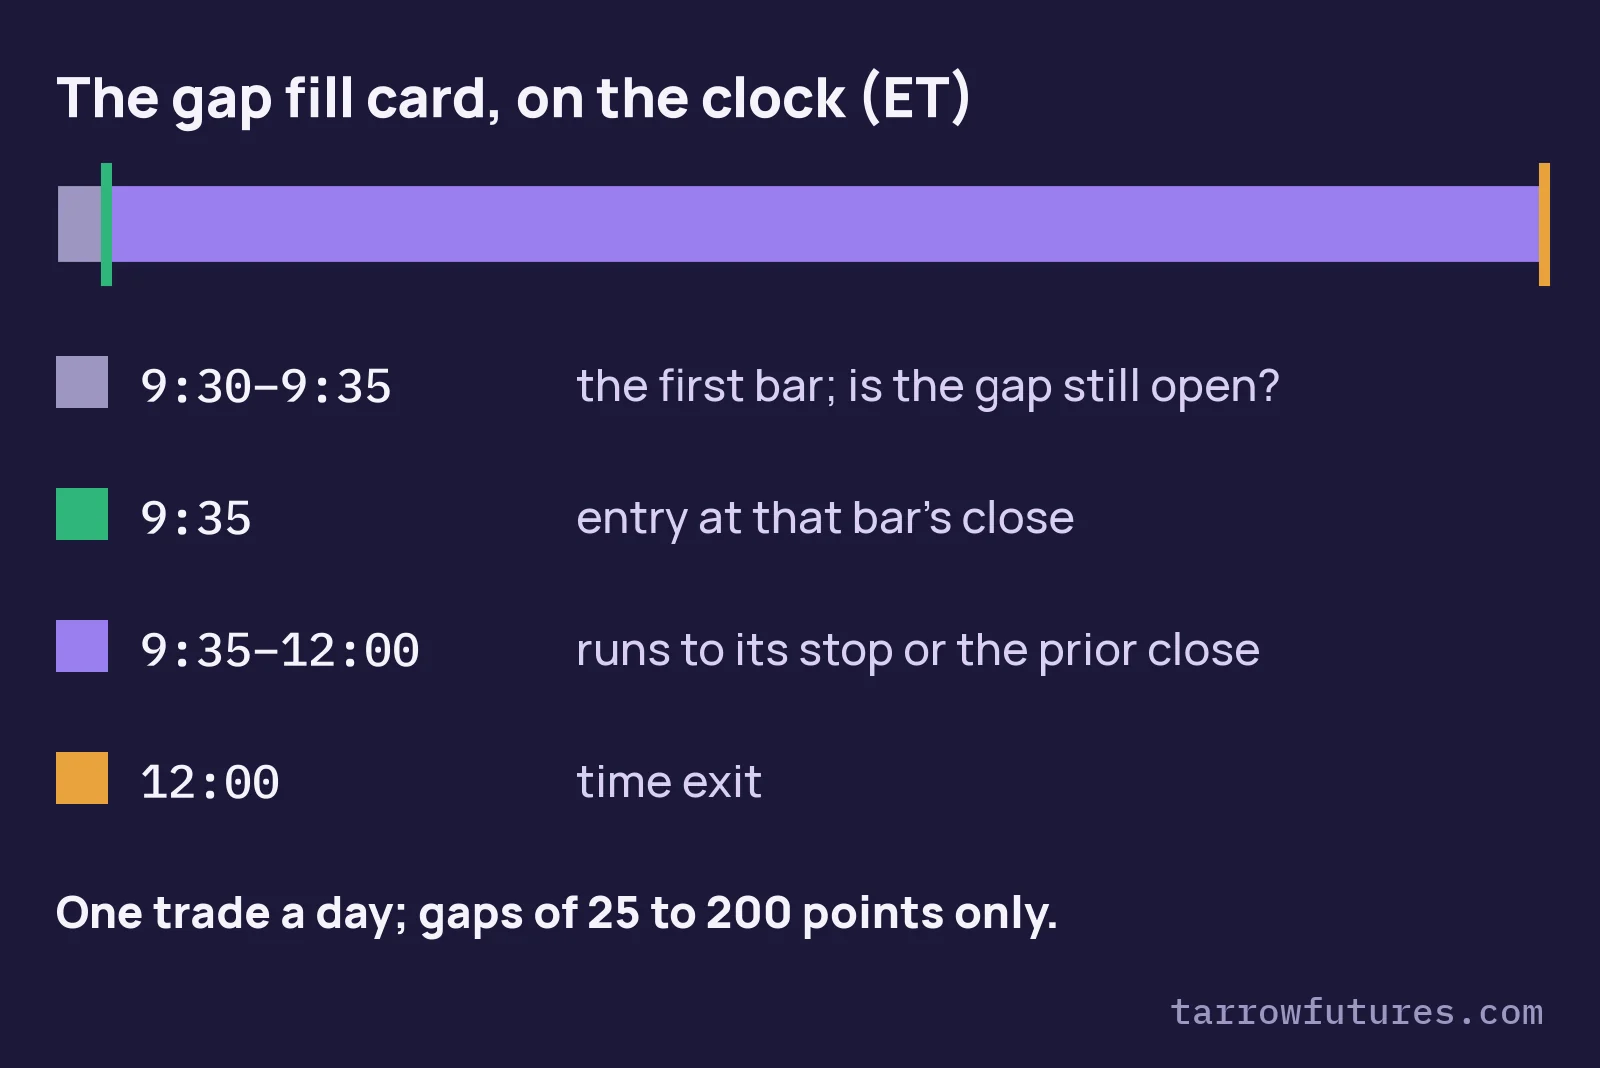
- Chart. 5-minute bars of the regular session.
- The gap. The
9:30open minus the prior16:00close. Trade only gaps of25to200points. - Setup. The
9:30bar closes without having traded back to the prior close. - Entry. That bar's close, toward the prior close.
- Stop. One tick past the
9:30bar's high (short) or low (long), at least10points away. - Target. The prior close. No trade if it is closer than the stop. If the stop and the target trade in the same bar, the stop counts.
- Time exit. Out at
12:00ET if neither has traded. - Limits. One trade a day.
It trades against the opening move, like the VWAP mean reversion strategy trades back toward VWAP. The opening drive strategy does the opposite: it goes with a strong first half hour.
A real session where the rules worked: MNQ, 28 October 2026
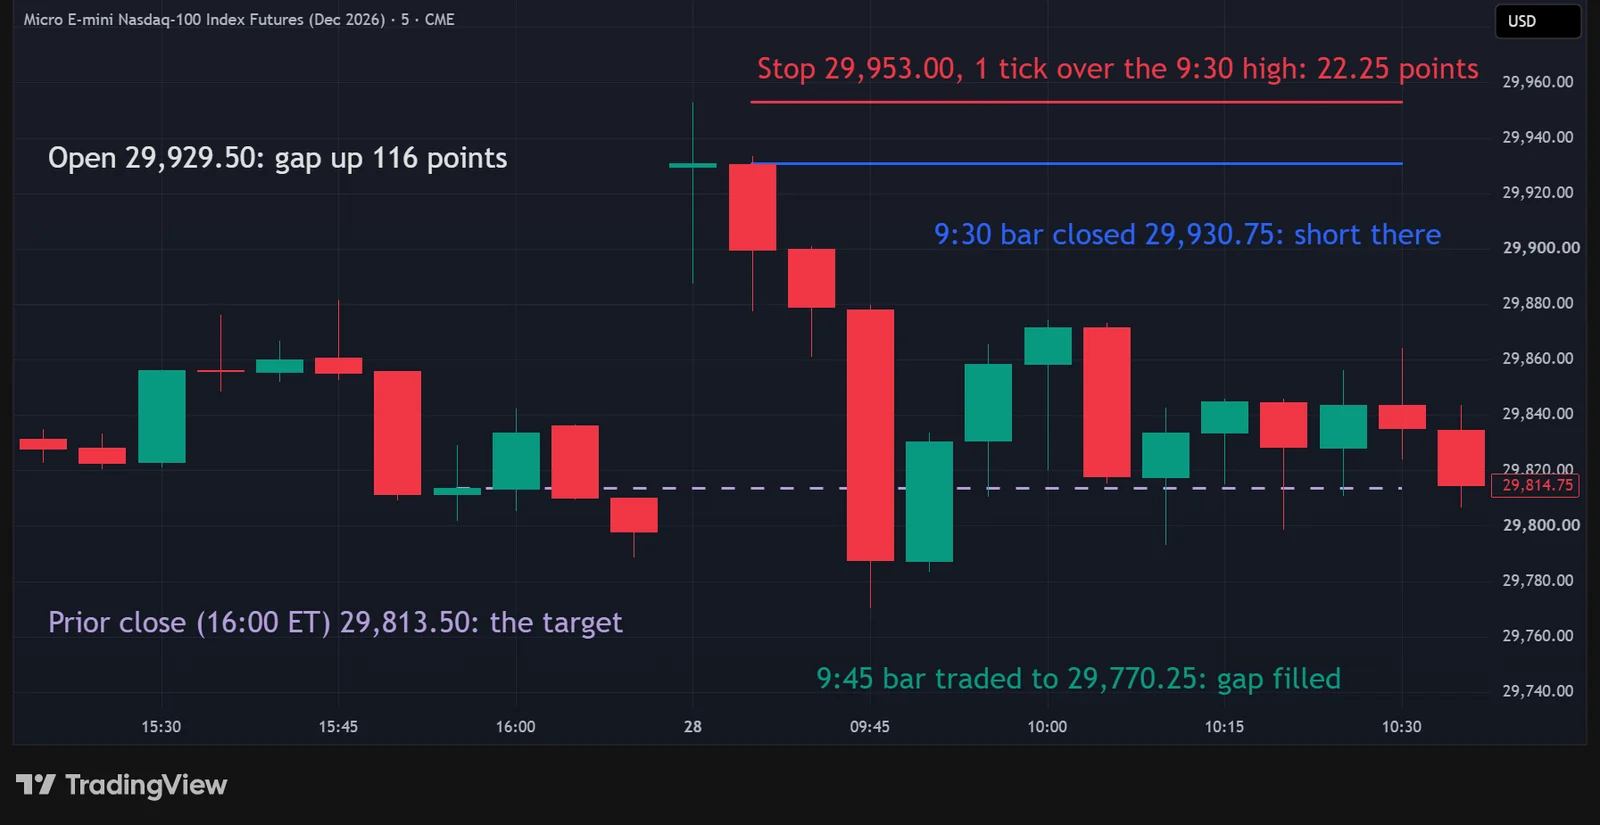
On 27 October the 15:55 bar closed at 29,813.50. The next morning the regular session opened at 29,929.50, a gap up of 116 points, inside the card's range. The 9:30 bar traded between 29,887.25 and 29,952.75 and closed at 29,930.75, nowhere near the prior close: a short.
The stop went one tick over the first bar's high, 29,953.00 (22.25 points, $44.50 a micro), and the target was the prior close, 117.25 points away. The worst point was the 9:35 high, 29,933.50, 2.75 points against the entry. Two bars later, the 9:45 bar traded down to 29,770.25, through the prior close: target, 117.25 points, $234.50 a micro, before costs. Hypothetical: what the written rules would have done that day, not trades anyone placed. A past session, selected to show the rules, not a typical result.
A real session where the same rules failed: MNQ, 6 October 2026
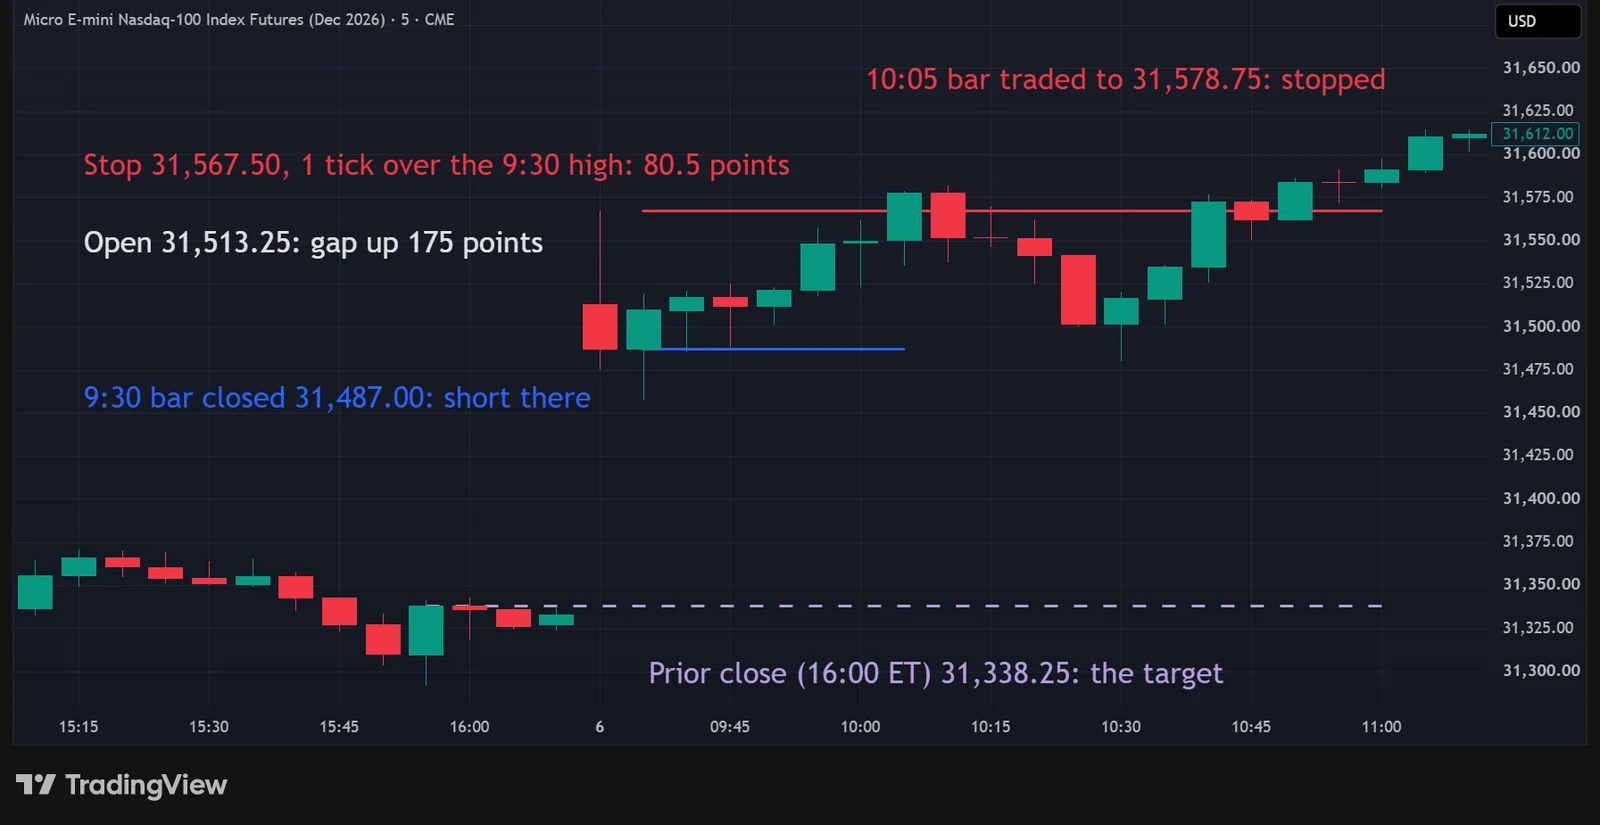
On 5 October the 15:55 bar closed at 31,338.25. The next session opened at 31,513.25, 175 points higher. The 9:30 bar was wide, 31,475.50 to 31,567.25, and closed at 31,487.00 with the gap still open: a short, with the stop at 31,567.50, 80.5 points away ($161 a micro), and the target at the prior close, 148.75 points away.
The 9:35 bar dipped to 31,457.50, 29.5 points in the trade's favour. That was the low of the whole session. Price climbed from there, and the 10:05 bar traded to 31,578.75 and took the stop: −$161 a micro, before costs. The gap never filled that day; the session's low stayed 119.25 points above the prior close. Selected to show the rules, not a typical result.
The bigger lesson is the stop. A 91.75-point first bar put the stop 80.5 points away, against 22.25 on 28 October. A trader who used the same contract count both days would have risked more than three times as much on the day that lost.
Hypothetical results. The outcomes above are what the written rules would have done on selected past sessions, before commissions and slippage; they are not trades anyone placed. CFTC Rule 4.41: hypothetical or simulated performance results have certain limitations. Unlike an actual performance record, simulated results do not represent actual trading. Also, since the trades have not been executed, the results may have under- or over-compensated for the impact, if any, of certain market factors, such as lack of liquidity. Simulated trading programs in general are also subject to the fact that they are designed with the benefit of hindsight. No representation is being made that any account will or is likely to achieve profit or losses similar to those shown.
How the gap fill fits prop firm rules
- Daily loss limit. One trade a day means the worst day is one stop, but the stop is new every morning. At
$200a trade (example budget), 28 October is$200 ÷ $44.50 = 4.49, so4MNQ ($178at risk); 6 October is$200 ÷ $161 = 1.24, so1MNQ ($161). Keeping4MNQ on 6 October would have been4 × $161 = $644on one trade. The position size calculator does the division for your numbers. - Size after
9:35, not before. The stop isn't known until the first bar closes, so the contract count can't be planned the night before. - Release days. A large gap can follow overnight news or an
8:30ET report such as CPI or the jobs numbers. Check your firm's news window against prop firm news trading rules before a release-day open. - Consistency. At
1MNQ, 28 October was$234.50. Under a rule that caps your best day at half of total profit (example rule), that needs$469of total profit before it fits. Check yours with the consistency rule checker.
Common mistakes
- Measuring the gap from the wrong close. The last trade at
16:00ET, the settlement price and the17:00ET close are different numbers. Mixing them changes which days qualify. - Fading every gap. The card skips gaps under
25and over200points. Those edges are teaching choices, not tested values; test your own before trusting them. - Entering at the open. The first bar decides the stop. Entering before it closes means trading without knowing where the stop goes.
- Fixed size across days. The stops in the two examples were
22.25and80.5points. One contract count on both means very different risk. - Holding a gap trade all day. A gap that hasn't filled by midday is a different market from the one at
9:35. The card's12:00exit makes that decision before the session. - Testing without costs. The first minutes of the session move fast. Add commission and a few ticks of slippage to every fill.
To see how other day trading strategies compare under the same prop firm rules, read futures trading strategies ranked by difficulty.
Test it before you trade it
Write the rules so two people would code them the same way, backtest them on your contract over many sessions with costs, record the gaps the card skipped as well as the ones it took, split the results by gap size, run the widest first-bar stop through your firm's daily limit, then forward-test on a simulator. Our free guide, Build It, Break It, Then Trade It, walks through each step.
The full gap fill breakdown has the rule card, both real MNQ sessions step by step, and the prop-rule arithmetic in one place. It is free with your email, below.
Charts are TradingView snapshots of past sessions (MNQ December 2026 contract, 5-minute bars); the levels and labels on them were added by Tarrow Futures. Trade outcomes shown are hypothetical; see the CFTC Rule 4.41 notice after the examples above. Diagrams labelled as illustrations are drawn by Tarrow Futures and are not market data.
Free strategy breakdown · free with your email
Gap fill breakdown
The rule card, a real MNQ gap that filled in fifteen minutes, and one that never filled. We email you the link, so it is one tap away next time.
✓ It's yours. The link is on its way to your inbox. Open the gap fill breakdown now
Read the free overview firstQuestions
What is a gap fill in futures?
A gap is the distance between where a session opens and where the previous one closed; a gap fill is price trading back to that prior close. Index futures trade almost around the clock, so the gap has to be defined between two fixed times. The version here uses the regular session's 9:30 ET open against the prior regular session's 16:00 ET close.
How does the gap fill strategy work?
In the version shown here, you wait for the first 5-minute bar of the session to close. If it has not traded back to the prior close and the gap is 25 to 200 points, you trade toward the prior close at that bar's close, with the stop one tick past the bar's far end and the prior close as the target. One trade a day, out at 12:00 ET. It is shown as a worked example of the rules; that is not evidence it is profitable.
Do all gaps fill?
No. On 6 October 2026 MNQ opened 175 points above the prior close, and the session's lowest price stayed 119.25 points above it; the gap never filled that day. We do not publish fill rates from our own sessions. Measure your own on your contract over many sessions before relying on any number.
Where does the stop go on a gap fill trade?
In this version, one tick past the first 5-minute bar's high after a gap up, or its low after a gap down, at least 10 points away on MNQ. The stop depends on how wide that first bar is, so it changes every day. On the two MNQ sessions shown here it was 22.25 points and 80.5 points.
How much should I risk on a gap fill trade in a prop account?
Size each trade from that day's stop. Contracts = the money you allow per trade ÷ (stop distance in points × the contract's point value), rounded down. With $200 a trade (example budget) on MNQ at $2 a point, a 22.25-point stop allows 4 contracts and an 80.5-point stop allows 1.
Educational material only. Not financial, investment or trading advice, and not a recommendation to trade any contract or size. Prop firm rules differ and change; the current rulebook of the firm you use decides. Worked examples use example figures, not results. Futures trading involves substantial risk of loss. Evaluations are paid tests and most people who take one do not pass.