Home / Blog / Strategy Testing & Automation
Strategy Testing & Automation
What is the EMA trend following strategy?
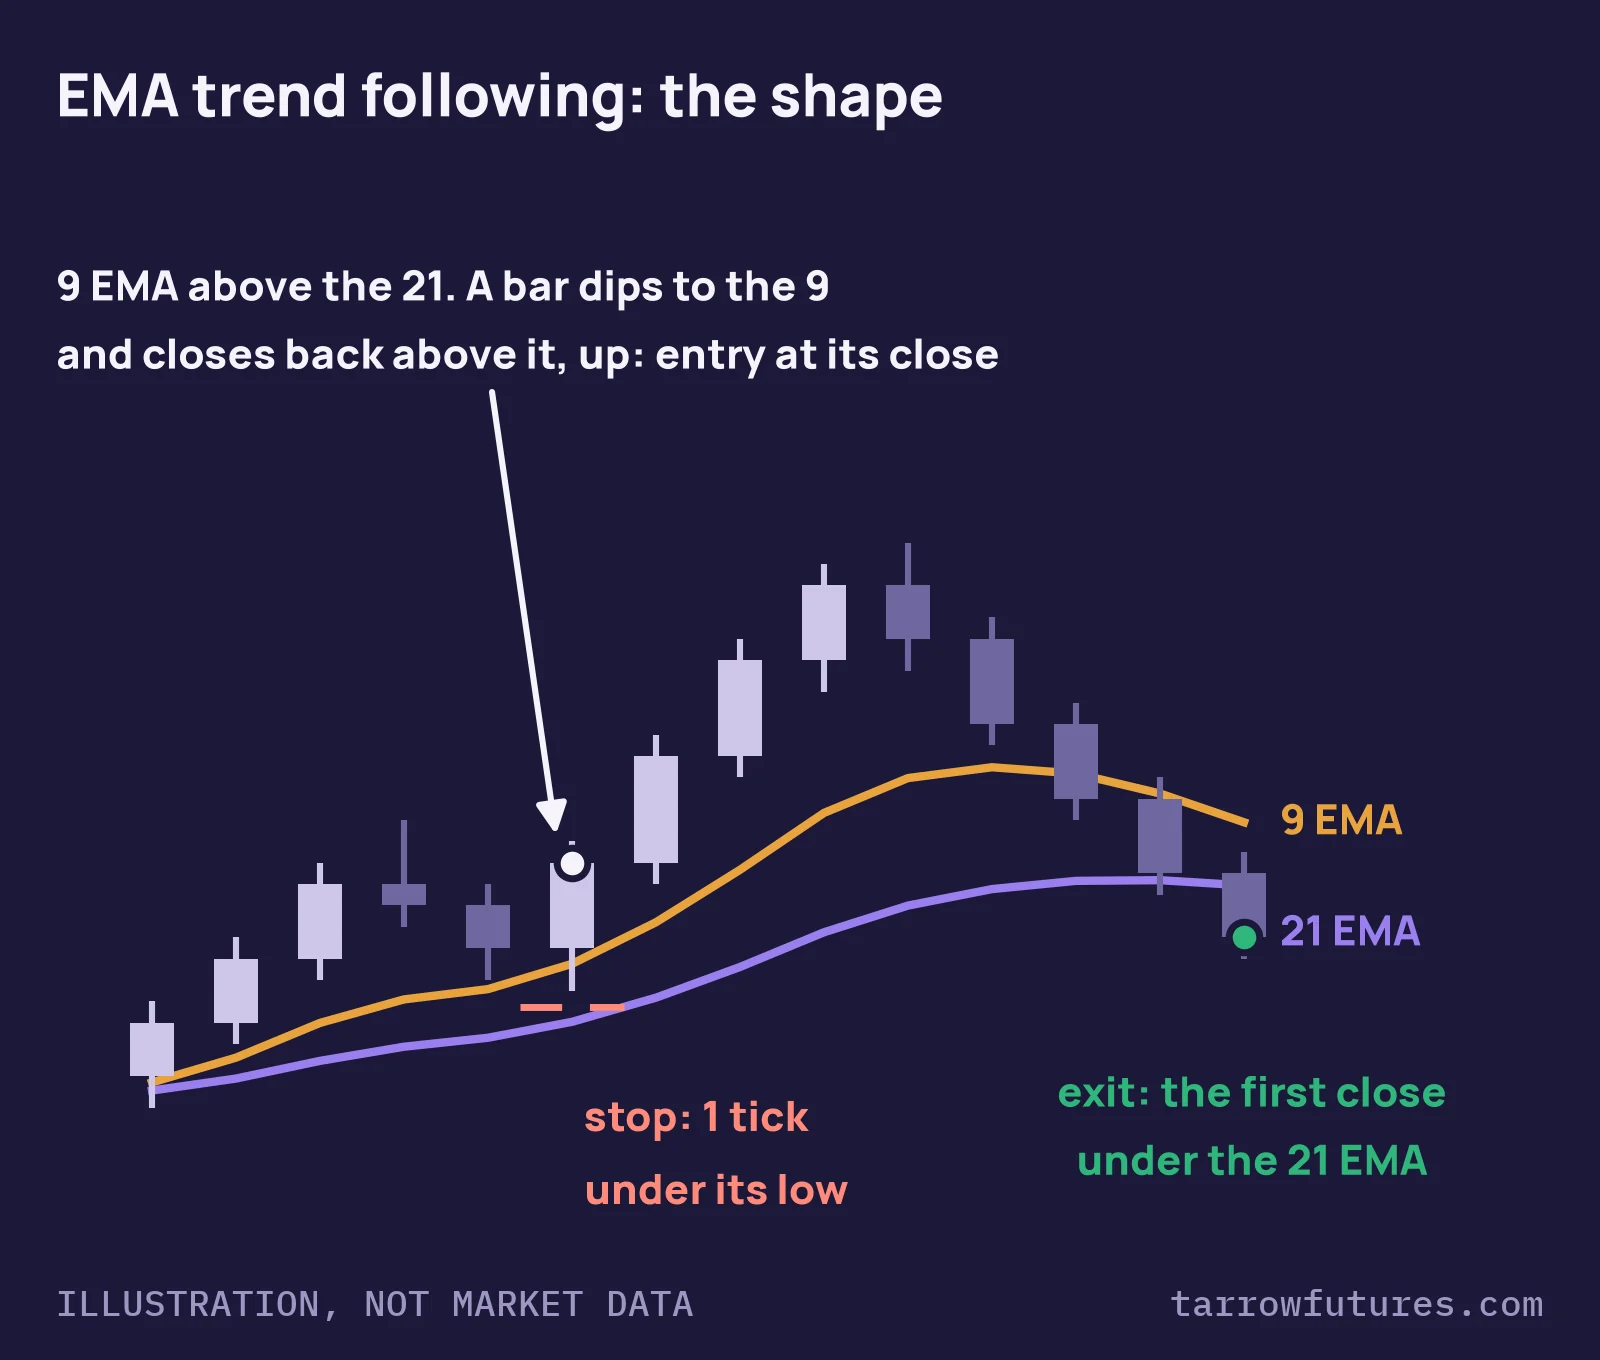
EMA trend following uses two exponential moving averages to decide the trend, then trades only in that direction. In the common intraday version shown here, the trend is up while the 9 EMA is above the 21 EMA on 5-minute bars; a bar that dips to the 9 EMA and closes back above it is the entry, and the first close under the 21 EMA is the exit.
This post defines each part as a number, walks through two real MNQ sessions (a trend day and a day of two quick stops), and shows how a trailing exit fits a prop account's daily loss limit and trailing drawdown.
Free strategy breakdown · free with your email
EMA trend following breakdown
The rule card, a real MNQ trend day, a real day of two quick stops, and what the trailing exit gives back.
✓ It's yours. The link is on its way to your inbox. Open the ema trend following breakdown now
Read the free overview firstEMA trend following, defined
An exponential moving average is an average of recent closes that weights the newest ones most, so it turns faster than a simple average of the same length. A 9-period EMA follows price closely; a 21-period EMA lags further behind. When the fast line is above the slow one, recent closes are higher than older ones: an up-trend, by this definition.
| Term | Meaning |
|---|---|
| 9 EMA, 21 EMA | Exponential moving averages of the last 9 and 21 closes, on 5-minute bars |
| Trend | Up while the 9 EMA is above the 21; down while it is below |
| Pullback | A bar whose low reaches the 9 EMA in an up-trend (its high, in a down-trend) |
| Trailing exit | No fixed target: the trade ends at the first close on the other side of the 21 EMA |
| Carry-over | On a regular-session chart the EMAs continue from the previous day's bars; they do not restart at 9:30 |
It is not the same as an EMA crossover strategy, which buys every cross of the fast line over the slow one and sells every cross back. Here the cross only sets the direction, and the entry waits for price to come back to the fast line.
The rules, as a checklist
- Chart. 5-minute bars of the regular session,
9and21EMA of the close. - Trend. Up if the 9 EMA is above the 21 at the bar's close; down if below.
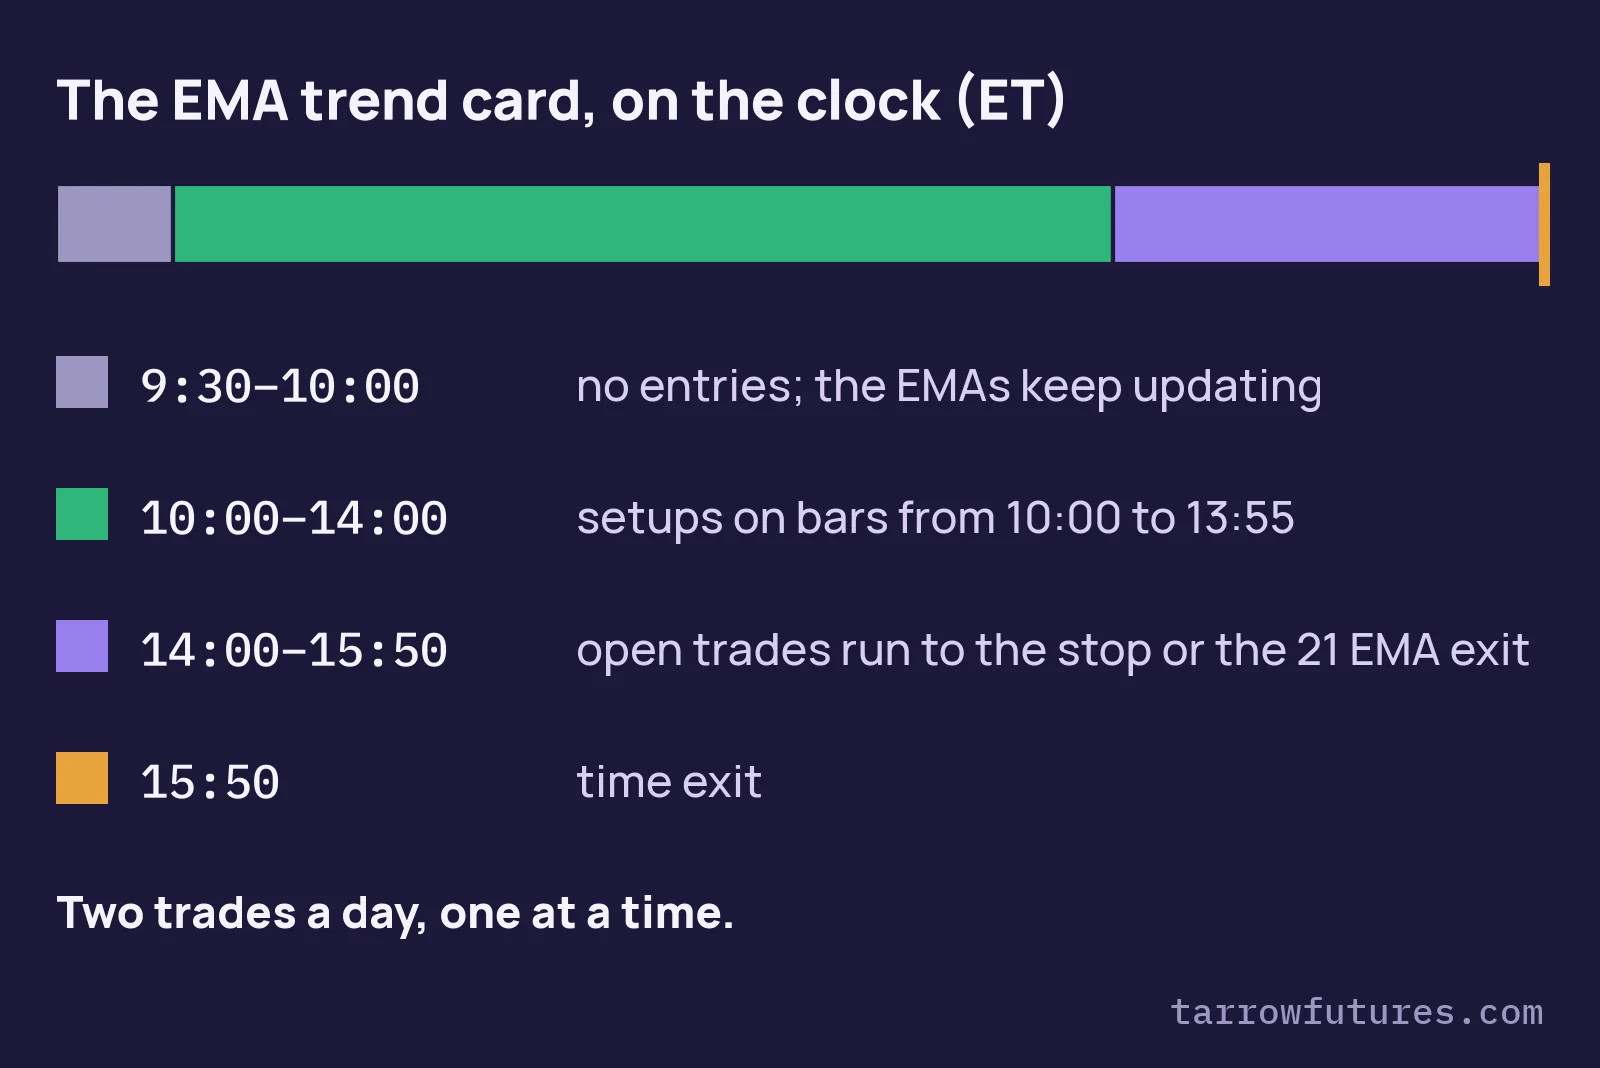
- Window. Setups count on bars that start from
10:00through13:55ET. - Long setup. Trend up; the bar's low reaches the 9 EMA or goes below it; the bar closes above the 9 EMA and higher than it opened. Shorts are the mirror.
- Entry. The setup bar's close.
- Stop. One tick past the setup bar's low (long) or high (short), at least
10points away. - Exit. The close of the first bar that closes on the other side of the 21 EMA. If the stop trades first, the stop counts.
- Limits. One trade at a time, two a day. Flat at
15:50ET.
A real session where the rules worked: MNQ, 27 October 2026
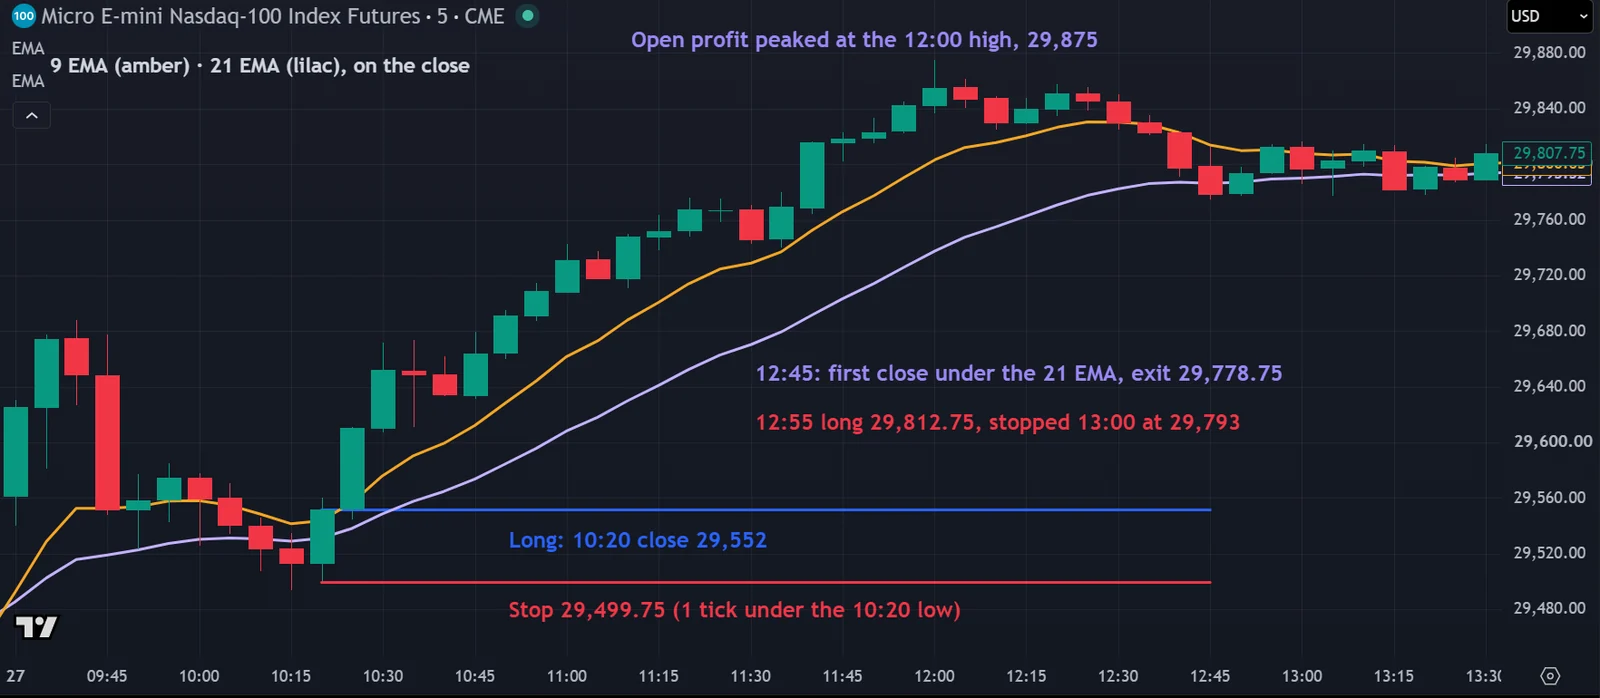
At the 10:20 close the 9 EMA was 29,543.59 and the 21 EMA 29,531.09: trend up. That bar's low, 29,500, went under the 9 EMA, and it closed at 29,552, above the 9 EMA and above its open. That was a long with the stop one tick under the low, at 29,499.75 (52.25 points).
Price climbed until noon without a close under the 21 EMA and reached 29,875 on the 12:00 bar, 323 points above the entry. Then it drifted, and the 12:45 bar closed at 29,778.75, under the 21 EMA (29,786.33). The exit was 226.75 points above the entry, $453.50 a micro, and 96.25 points below the best price.
The trend was still up on the EMAs, so the 12:55 bar gave a second setup: long 29,812.75, stop 29,793 (19.75 points). The 13:00 bar traded down to 29,785.75: −$39.50 a micro. The day was +207 points, $414 a micro, before costs. Hypothetical: what the written rules would have done that day, not trades anyone placed. A past session, selected to show the rules, not a typical result.
The same morning is the failed example in our range trading strategy: the day the first-hour range broke was the day the trend ran.
Free strategy breakdownSee it on real charts: the ema trend following breakdown has the rule card, a day it worked and a day it failed.Get it ↓A real session where the same rules failed: MNQ, 28 October 2026
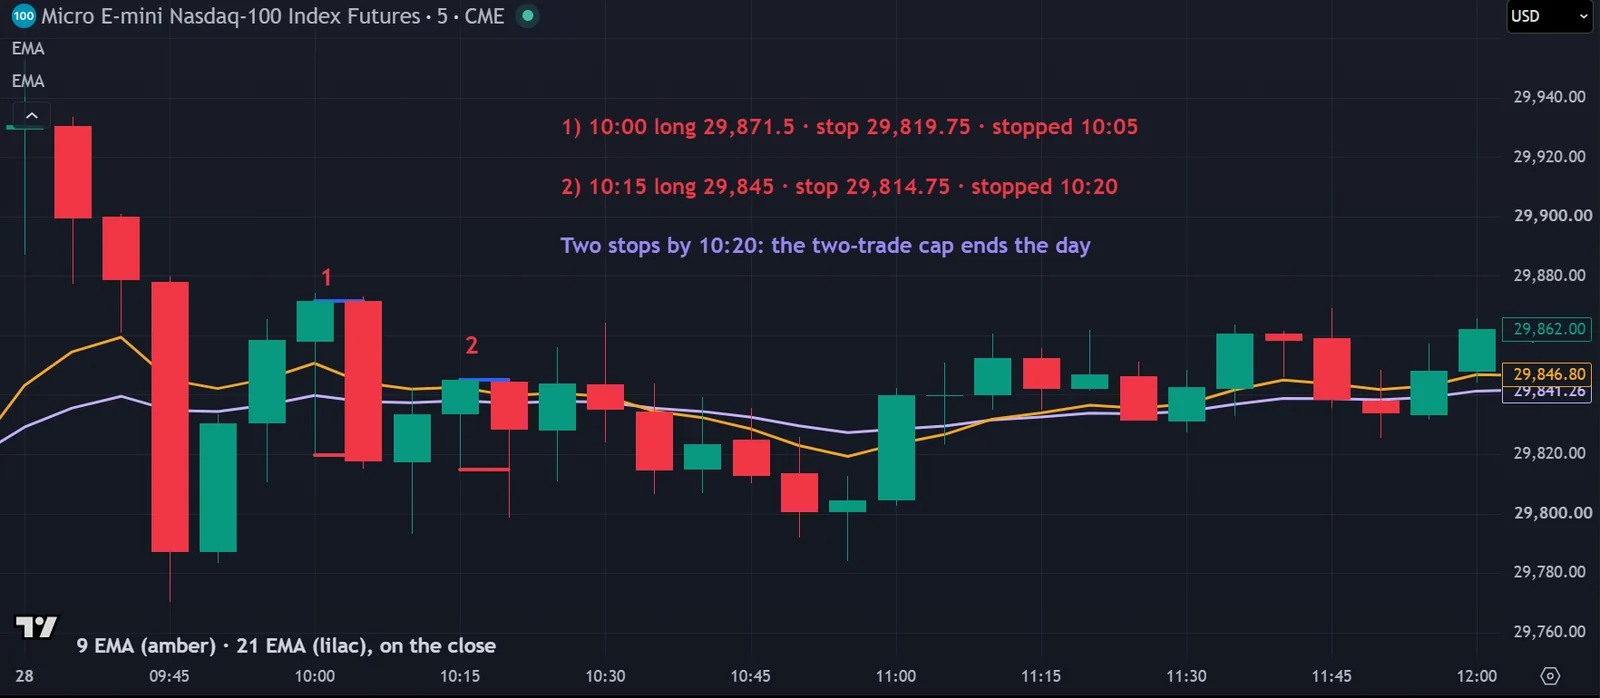
At the 10:00 close the 9 EMA was 29,850.61 and the 21 EMA 29,839.74, about 11 points apart: trend up, carried over from the previous afternoon. The 10:00 bar dipped to 29,820 and closed at 29,871.5: a long with the stop at 29,819.75 (51.75 points). The 10:05 bar traded down to 29,815.25. Stopped, −$103.50 a micro.
The 10:15 bar dipped to 29,815 and closed at 29,845, just above the 9 EMA (29,842.54), which was now about 4 points above the 21: a second long, stop 29,814.75 (30.25 points). The 10:20 bar traded down to 29,798.50. Stopped again, −$60.50 a micro. The cap of two ended the day at 10:20: −82 points, −$164 a micro, before costs. At 10:35 the 9 EMA crossed under the 21, and the lines kept crossing through late morning. Selected to show the rules, not a typical result.
The trend filter said "up" at both entries, but the lines were flat and close together, and price was going sideways. The rules cannot tell a pullback in a trend from a bar in the middle of a range; they decide what each wrong guess costs. The stop past the setup bar sets that cost before the entry, and the two-trade cap ends the day before the crossings pile up.
Hypothetical results. The outcomes above are what the written rules would have done on selected past sessions, before commissions and slippage; they are not trades anyone placed. CFTC Rule 4.41: hypothetical or simulated performance results have certain limitations. Unlike an actual performance record, simulated results do not represent actual trading. Also, since the trades have not been executed, the results may have under- or over-compensated for the impact, if any, of certain market factors, such as lack of liquidity. Simulated trading programs in general are also subject to the fact that they are designed with the benefit of hindsight. No representation is being made that any account will or is likely to achieve profit or losses similar to those shown.
How EMA trend following fits prop firm rules
- Daily loss limit. Two trades a day means two stops can happen, and on 28 October they came twenty minutes apart. Size each trade from its own stop, then check the worst day: at
$200a trade (example budget), that is up to$400. The position size calculator does the division for your own numbers. - Trailing drawdown. A trailing exit never sells the top. Under an intraday trailing drawdown, the floor follows your highest balance, open profit included. Example figures, not results: at
1MNQ on 27 October, the long was+$646open at the high and closed at+$453.50. If the floor was still trailing, it rose$646while the balance rose$453.50: the room shrank by$192.50on a winning trade. - Consistency. Trend following earns most of its points on a few trend days. At
1MNQ, 27 October was$414; under a rule that caps your best day at half of total profit (example rule), that needs$828of total profit before it fits. Check yours with the consistency rule checker. - Close-out time. Many firms require you to be flat by a set time. If yours is earlier than the card's time exit, it becomes the time exit.
Common mistakes
- Trading a flat trend. Two EMAs a few points apart and both flat are not a trend, even if one is above the other. If you add a minimum gap or slope rule, test it first.
- Moving the exit to a fixed target after a winner. The exit on the 21 EMA is what lets a trend day pay for the flat days. Change it and you are testing a different strategy.
- Fixed size across trades. The two stops on 27 October were
52.25and19.75points. One contract on both means the first trade carries more than twice the risk of the second. Size each from its own stop. - Ignoring the carry-over. On a regular-session chart the EMAs at 9:30 come from yesterday's bars. A gap or a fast open can leave the lines pointing the old way for the first half hour.
- Testing without costs. Every exit at a bar's close is a market order. Add commission and slippage to every fill.
- Calling a filter from a handful of days. "Skip it when the EMAs are close" may sound right after 28 October. Until it has been tested on many sessions, it is only a guess.
To see how this compares with other day trading strategies under the same prop firm rules, read futures trading strategies ranked by difficulty. The VWAP pullback strategy is another way to join a trend on a pullback.
Test it before you trade it
Write the rules so two people would code them the same way, backtest them on your contract over many sessions with costs, record the best price of every trade as well as the exit, run two stops a day through your firm's daily limit, then forward-test on a simulator. Our free guide, Build It, Break It, Then Trade It, walks through each step.
The full EMA trend following breakdown has the rule card, both real MNQ sessions step by step, and the prop-rule arithmetic in one place. It is free with your email, below.
Charts are TradingView snapshots of past sessions with TradingView's built-in exponential moving averages (9 and 21, on the close); the levels and labels on them were added by Tarrow Futures. Trade outcomes shown are hypothetical; see the CFTC Rule 4.41 notice after the examples above. Diagrams labelled as illustrations are drawn by Tarrow Futures and are not market data.
Free strategy breakdown · free with your email
EMA trend following breakdown
The rule card, a real MNQ trend day, a real day of two quick stops, and what the trailing exit gives back. We email you the link, so it is one tap away next time.
✓ It's yours. The link is on its way to your inbox. Open the ema trend following breakdown now
Read the free overview firstQuestions
What is an EMA trend following strategy?
A strategy that uses exponential moving averages to decide the trend and only trades in that direction. In the version shown here, the trend is up while the 9 EMA is above the 21 EMA on 5-minute closes; a bar that dips to the 9 EMA and closes back above it is the entry, and the first close under the 21 EMA is the exit. It is shown here as a worked example of the rules; that is not evidence it is profitable.
What is the difference between EMA trend following and an EMA crossover strategy?
An EMA crossover strategy enters every time the fast EMA crosses the slow one. In the trend following version here, the cross only sets the direction; the entry waits for a pullback to the fast EMA, and the trade stays open until price closes on the other side of the slow EMA.
Which EMAs are used for day trading futures?
The 9 and 21 EMA on 1- to 5-minute bars is one common pair; 20 and 50 is another. The numbers change how fast the lines turn, and so how many trades the rules take and how much open profit the exit gives back. Whatever pair you choose, test that exact pair.
Why does EMA trend following lose on sideways days?
On a sideways day the two EMAs go flat and sit close together, so the trend filter still points one way while price is just rotating. A pullback to the fast EMA is then just a bar in the middle of a range, and the stop is close. A cap on trades per day limits how many times that happens.
How much should I risk on an EMA trend trade in a prop account?
Size each trade from its own stop. Contracts = the money you allow per trade ÷ (stop distance in points × the contract's point value), rounded down. With two trades a day allowed, check that two stops fit inside your daily loss limit, and remember that a trailing exit gives back open profit that an intraday trailing drawdown has already counted.
Educational material only. Not financial, investment or trading advice, and not a recommendation to trade any contract or size. Prop firm rules differ and change; the current rulebook of the firm you use decides. Worked examples use example figures, not results. Futures trading involves substantial risk of loss. Evaluations are paid tests and most people who take one do not pass.