Home / Resources / Strategy library / Liquidity sweep reversal
Strategy library · Education only
Liquidity sweep reversal: trade the close back inside, not the wick.
A bar trades through the morning high or low and closes back inside the range; the trade goes the other way, with the stop just past the sweep. Here are the rules, two real MNQ sessions, and why a second sweep is the risk to plan for.
Unlocked. Your link is on its way by email. Jump to the full breakdown ↓
The full breakdown · free with your email
Unlock the full liquidity sweep reversal breakdown
The rule card, a real MNQ sweep that reached its target, a real one stopped by a second sweep, and how it fits prop firm rules. The free overview is below; we also email you the link, so it is one tap away next time.
What is a liquidity sweep?
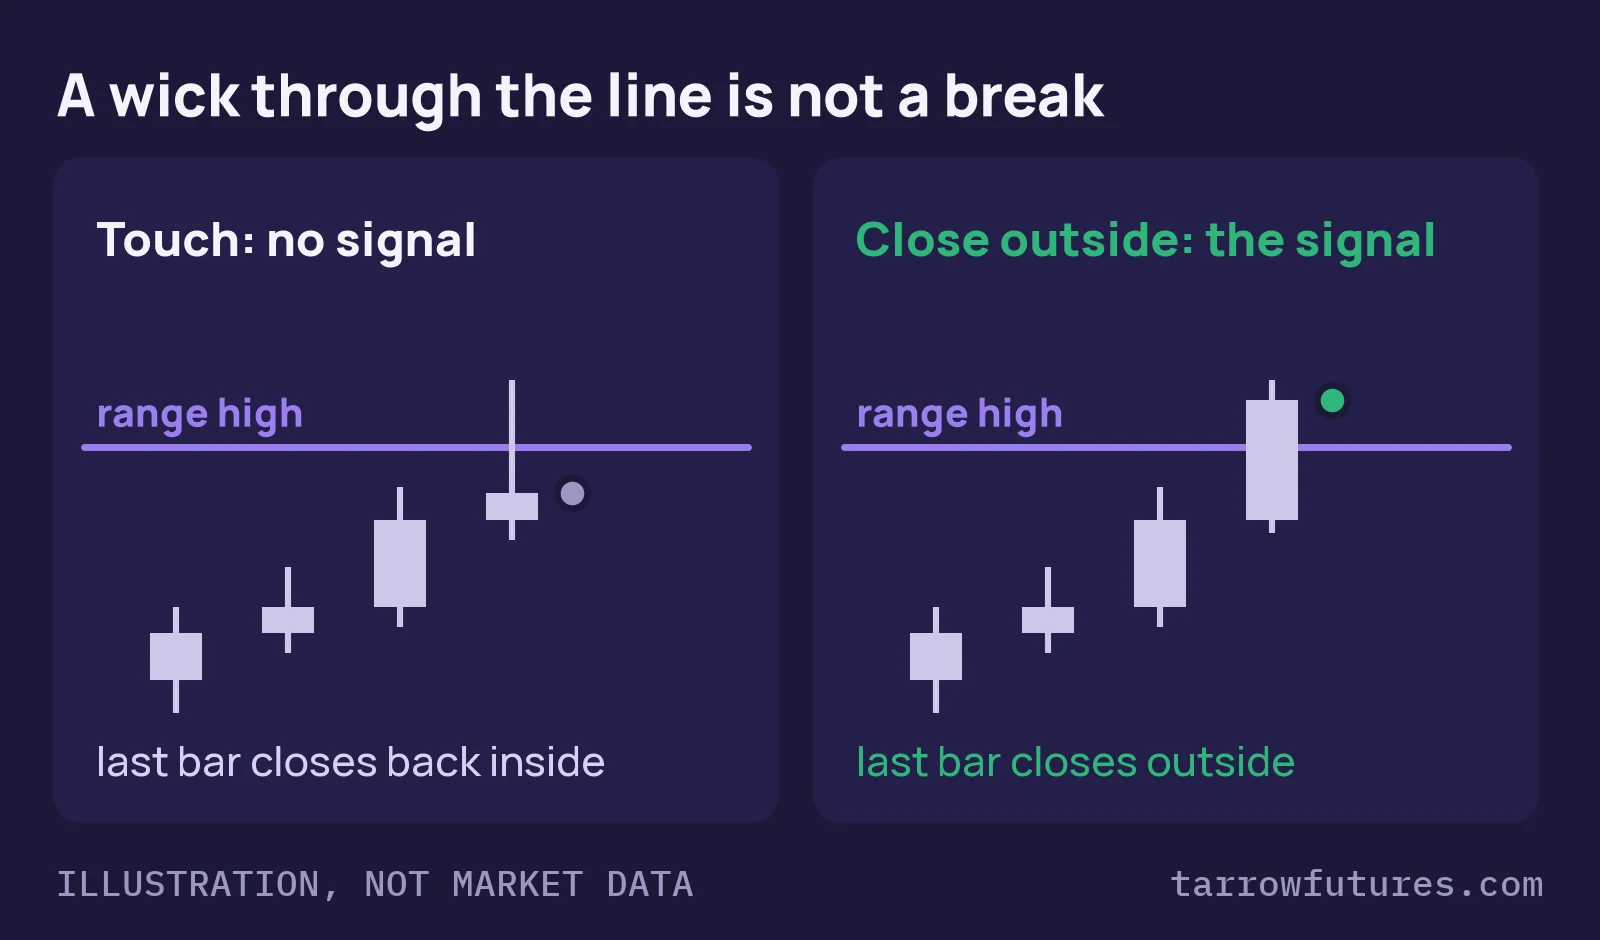
A liquidity sweep is when price trades through an obvious level, such as the morning high or low, and then closes back on the side it came from. The wick goes through the level; the close does not. Sweeps happen at obvious levels because that is where resting orders tend to sit: stops on one side, breakout entries on the other. Traders also call it a stop run or a liquidity grab.
For the idea itself, with a real MNQ day and how a sweep differs from a breakout and a fake breakout, read what is a liquidity sweep. This page is the strategy built on it.
What is the liquidity sweep reversal strategy?
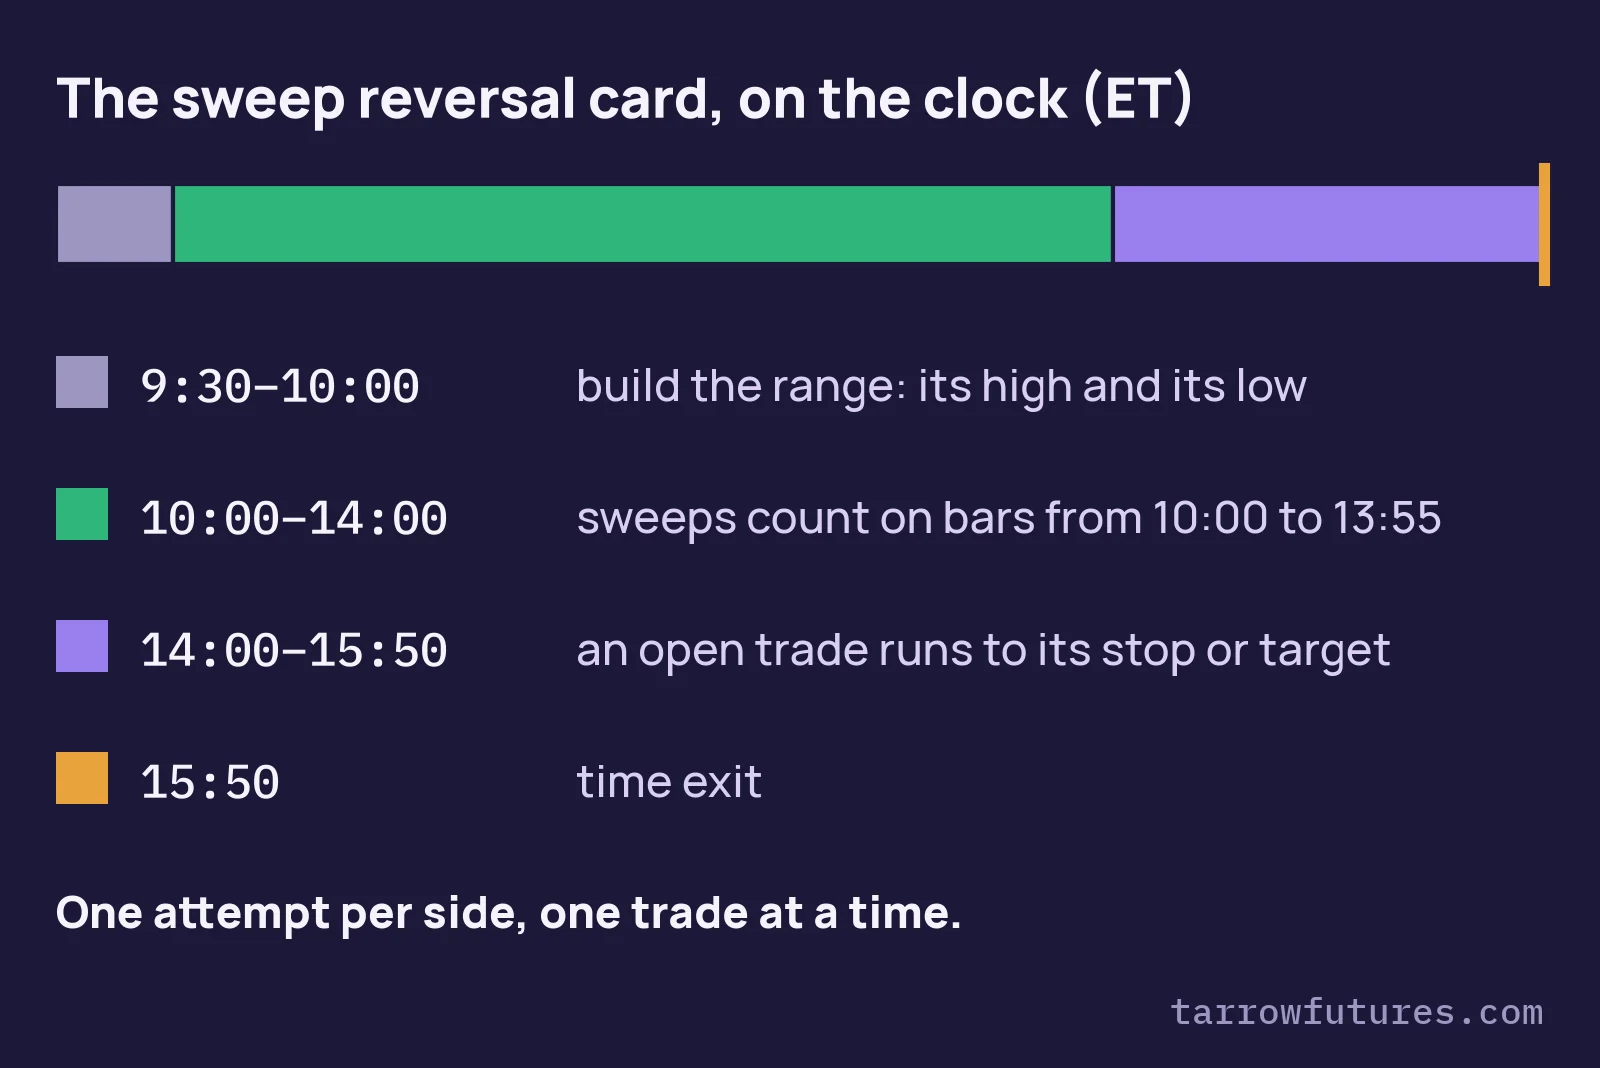
The version on this page trades the rejection. It marks the high and the low of the first half hour of the session,
9:30 to 10:00 ET. After that, a 5-minute bar that trades through one of those levels and closes back
inside is the setup, and the trade goes the other way: back into the range. The stop goes one tick past the sweep's extreme,
and the target is twice the stop distance.
It is not the same as the prior-day high/low strategy, which uses yesterday's levels on 1-minute bars, or the opening range breakout, which trades a close outside the range instead of a close back inside it.
The idea in five lines
- Levels: the high and the low of the 9:30–10:00 ET range, on 5-minute bars.
- Setup: a bar opens inside the range, trades through the high (or low) and closes back inside. Bars from
10:00to13:55ET. - Entry and stop: the setup bar's close; the stop one tick past the sweep's extreme, at least
10points away. - Target: twice the stop distance (2R).
- Limits: one attempt per side a day, and a side is finished once a bar closes beyond it; flat at
15:50ET.
Each choice changes the strategy. The range could be 15 minutes or the prior day; the target could be the middle of the range. We teach this version as a worked example of the rules; that is not evidence it is profitable.
Why it is hard to trade inside a prop account
A sweep and the start of a real breakout look the same when the bar closes: a wick through the level and a close back inside. Sometimes price comes back for a second, deeper push and takes the stop. On the failed MNQ session in the full breakdown, the morning high was swept twice in fifteen minutes, and the second sweep hit the first trade's stop. The stop sits just past the wick, so it is small, which tempts traders to size up and to re-enter.
What is in the full breakdown
- The rule cardExact range, setup, entry, stop, target and time rules, written so you could code them.
- A real session where it workedMNQ, 9 Oct 2026, 5-minute chart: a sweep of the range low at 10:10 and the target reached at 12:50.
- A real session where it failedMNQ, 1 Oct 2026: a sweep of the range high at 13:30, stopped fifteen minutes later by a second sweep.
- Prop-rule fitSizing a small stop, the daily loss limit, the re-entry trap and consistency, worked in numbers.
- A test-it-yourself planHow to backtest and stress-test it before it costs you an evaluation.
The full breakdown · free with your email
Liquidity sweep reversal: rules, real charts, prop-rule fit
Preview below. Unlock it at the top of the page ↑ and it opens here.
1. The rule card
Liquidity sweep reversal, 9:30–10:00 ET range, 5-minute bars
- Chart. 5-minute bars of the regular session, from
9:30ET. - Levels. The range high is the highest high of the six bars from
9:30to9:55; the range low is their lowest low. - Window. Setups count on bars that start from
10:00through13:55ET, so the last entry is at14:00. - Short setup (sweep of the high). The bar opens below the range high, trades above it and closes back below it.
- Long setup (sweep of the low). The mirror: the bar opens above the range low, trades below it and closes back above it.
- A side is finished once any bar from
10:00closes beyond it. A close beyond the level is a break, not a sweep. - Entry. The close of the setup bar.
- Stop. One tick (
0.25) past the setup bar's high (short) or low (long). At least10points from the entry. - Target. Twice the stop distance from the entry (2R). If the stop and the target both trade in one bar, the stop counts.
- Limits. One attempt per side a day, one trade at a time. If the trade is still open at
15:50ET, exit then. - Size. Contracts = the money you allow per trade ÷ (stop distance in points × the contract's point value), rounded down. If one contract is already more than you allow, there is no trade.
Rules 4 to 6 are what make it a sweep strategy. The close decides: a wick through the level and a close back inside is a
setup, a close beyond it ends that side for the day. Rule 10's one attempt per side is what stops a second and third push
through the same level from becoming a second and third loss. Point values come from CME Group's contract specs: MNQ is
$2 a point, NQ $20. Our examples use micros.
2. A session where the rules worked
Real chartSelected example, chosen to show the rulesTarget
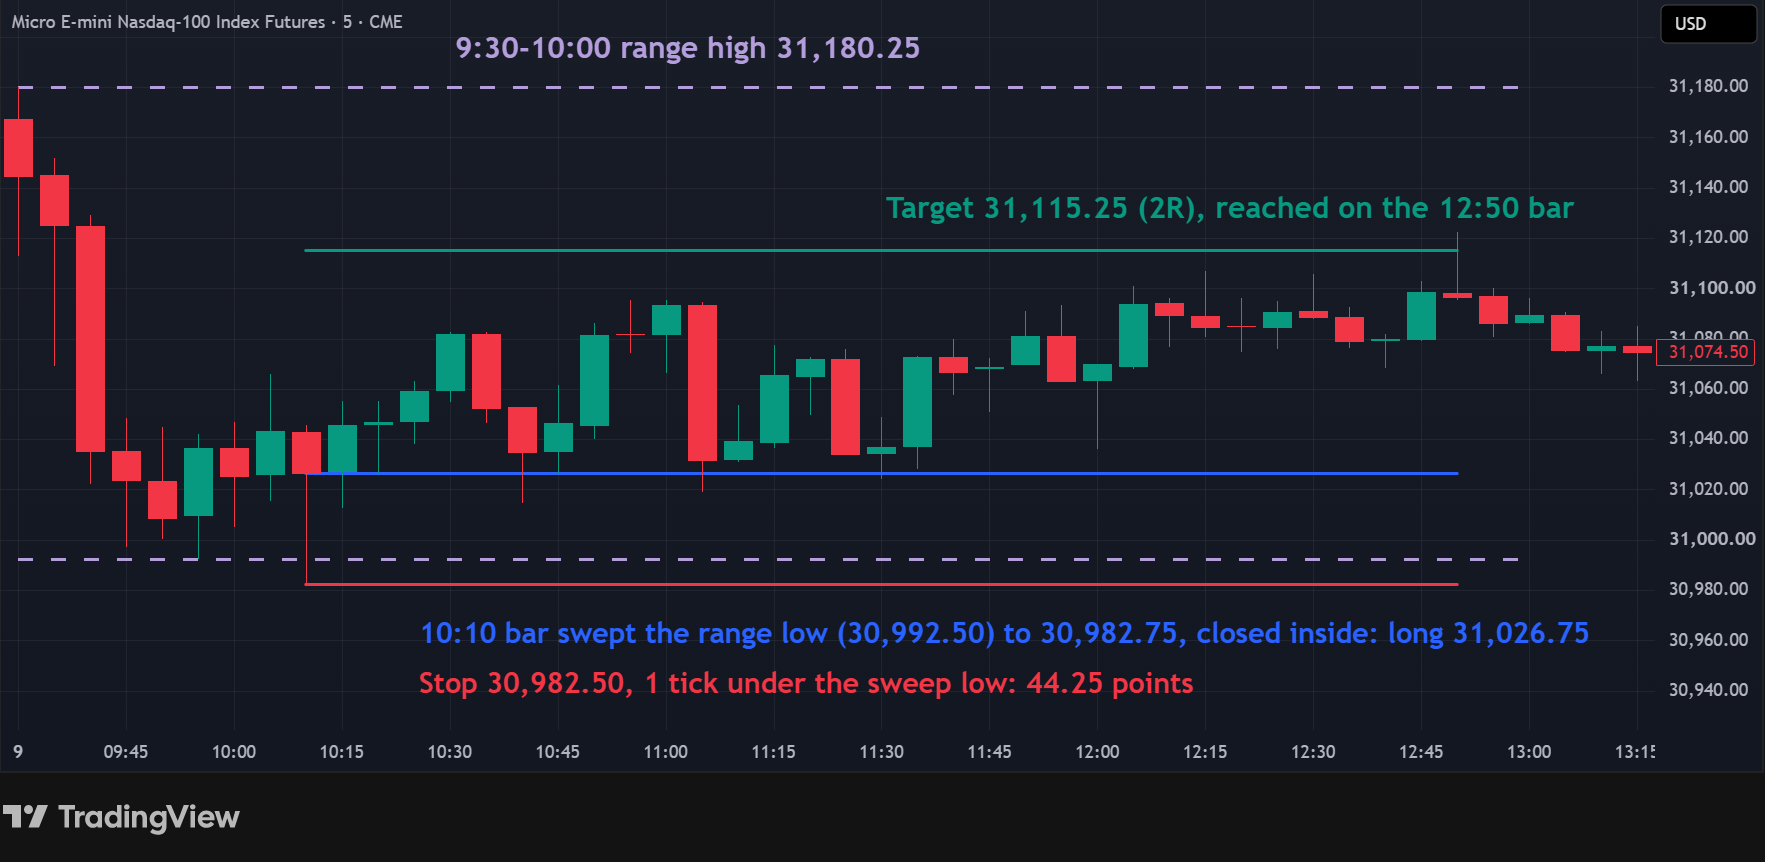
| Step | What the chart shows | Number |
|---|---|---|
| Range | 9:30–10:00 high and low (the low set on the 9:55 bar) | 30,992.50 to 31,180.25 |
| Sweep | 10:10 bar: opened 31,043, traded to 30,982.75, 9.75 pts under the low, closed inside | long 31,026.75 |
| Stop | One tick under the sweep's low | 30,982.50 (44.25 pts, $88.50 per MNQ) |
| Target | Entry + 2 × 44.25 | 31,115.25 |
| Worst point | 10:15 bar low | 31,012.50, 14.25 pts under the entry |
| Outcome | 12:50 bar traded to 31,122.50 | target: 88.5 × $2 = $177 per MNQ |
| Other side | No bar reached the range high before 14:00 | no second setup |
Read the chart from left to right. The session opened at the top of its range and fell for twenty-five minutes, setting the
low on the 9:55 bar. At 10:10 price dipped under that low by 9.75 points, found no
follow-through, and closed back inside: a long. The trade never came closer than 30 points to its stop and took
almost three hours to reach the target, on the 12:50 bar. Dollar figures are per micro contract, before
commissions and slippage. Hypothetical: what the written rules would have done that day, not trades anyone placed (CFTC Rule
4.41 notice below the next example).
3. A session where the same rules failed
Real chartSelected example, chosen to show the rulesStopped
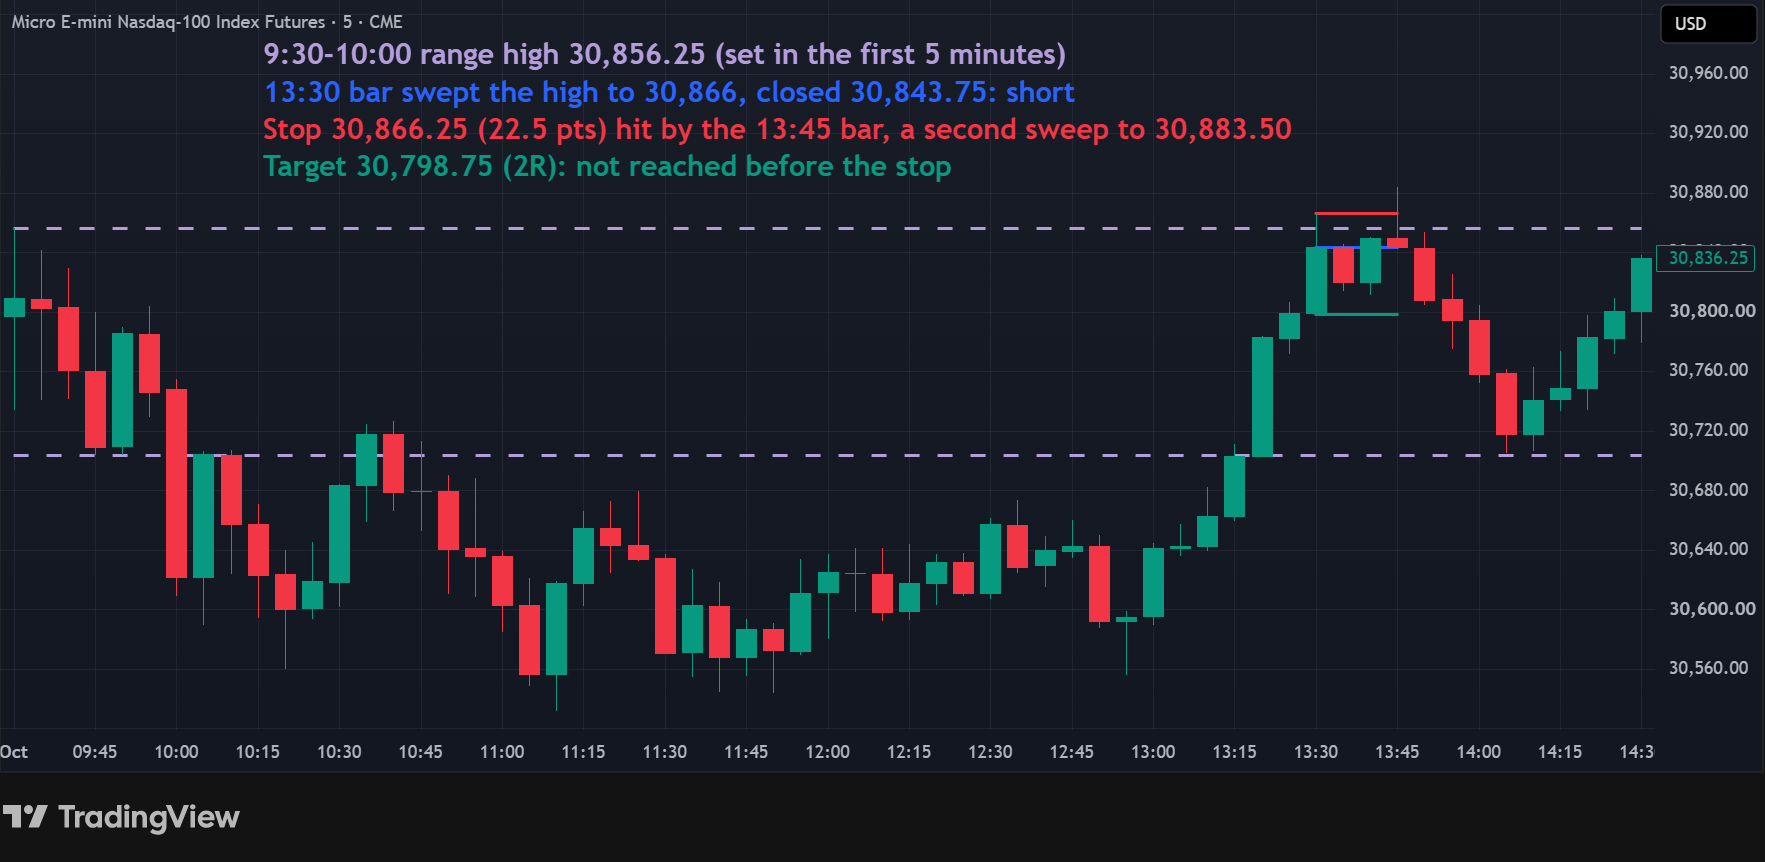
| Step | What the chart shows | Number |
|---|---|---|
| Range | 9:30–10:00 high (set on the 9:30 bar) and low | 30,703.50 to 30,856.25 |
| Low side | The 10:00 bar closed at 30,621.50, below the range low | finished (rule 6) |
| Sweep | 13:30 bar: opened 30,799, traded to 30,866, closed back below the high | short 30,843.75 |
| Stop | One tick over the sweep's high | 30,866.25 (22.5 pts, $45 per MNQ) |
| Target | Entry − 2 × 22.5; the 13:35 bar got within 15.25 pts of it | 30,798.75 |
| Outcome | 13:45 bar swept the high again, to 30,883.50 | stopped: 22.5 × $2 = −$45 per MNQ |
| Second sweep | Same side, already used (rule 10) | no trade |
The first sweep was textbook: 9.75 points through the high and a close back inside. Fifteen minutes later
price came back and pushed 27.25 points through the same level, far enough to take a stop one tick past the
first wick. A stop that sits just past a sweep is small, and it is also exactly where the next push goes.
The second sweep is the uncomfortable part. Under this card it was not a trade, because the high had already had its one
attempt. Had it been taken (short 30,843.25, stop 30,883.75, 40.5 points), it would
have reached its target on the 14:00 bar. On a day the level breaks for real, the same re-entry is a second
loss instead. We have not tested which rule does better over many sessions and do not offer either as the answer. Pick one
before the session, and test it.
Size from the stop. With $200 a trade (example budget), rule 11 gives $200 ÷ $45 = 4.44,
rounded down to 4 MNQ: a $180 loss on a 22.5-point stop. A small stop makes size
look cheap, and it means four contracts are hit by the same fifteen-minute push. Test any filter, such as a minimum depth
for the sweep, on many sessions before trusting it.
CFTC Rule 4.41: Hypothetical or simulated performance results have certain limitations. Unlike an actual performance record, simulated results do not represent actual trading. Also, since the trades have not been executed, the results may have under- or over-compensated for the impact, if any, of certain market factors, such as lack of liquidity. Simulated trading programs in general are also subject to the fact that they are designed with the benefit of hindsight. No representation is being made that any account will or is likely to achieve profit or losses similar to those shown.
4. How it fits prop firm rules
Daily loss limit: two sides means two stops can happen
Size each trade from its own stop, then check the worst day. Example figures: with $200 a trade, the 9 October
long is $200 ÷ $88.50 = 2.26, so 2 MNQ ($177 at risk); the 1 October short is
4 MNQ ($180). The card allows one attempt at the high and one at the low, so the worst day is two
stops, up to $400 at that budget. Put that against your daily loss limit before the first trade.
The re-entry trap
Without rule 10, a trader who sells every push through the high takes a new stop each time. On 1 October that was two
shorts in fifteen minutes at the same level. Example figures: the second one, sized at $200, is
$200 ÷ $81 = 2.47, so 2 MNQ and $162 at risk, on top of the $180 already
lost. Whatever you decide about second attempts, write the number down and count it against the daily limit.
Consistency rule: one target can be a large share of a quiet month
Example figures: at 1 MNQ, 9 October was $177. Under a consistency rule that caps your best day at
half of total profit (example rule), that day needs total profit of at least $177 × 2 = $354 before it fits.
Rules differ by firm; check yours.
Close-out time
The card's 15:50 ET exit is ours. Many firms set their own time by which positions must be flat; if yours is
earlier, it becomes the time exit. Check your firm's current rulebook.
5. Test it yourself before you trade it
- Write the card down exactly. Bar size, session, the range times, what "trades through" and "closes back inside" mean, when a side is finished, the stop and the minimum stop, the target, the attempt limit and the time exit. If two people could code it differently, it is not finished.
- Backtest it on your contract, many sessions. Record each sweep, how deep it went, the stop distance, the worst price while open and the outcome. Record the sweeps the card skipped too.
- Look at the second sweeps. Count how often a stopped trade was followed by another sweep of the same level, and how often the level then broke. That decides your re-entry rule; don't decide it from one day.
- Add costs. Commission both ways and slippage on every fill. On a
22.5-point stop, a few ticks of slippage is a bigger share of the risk than on a wide one. - Run your size through the rules. Two stops a day × risk per trade against your daily limit, your best day against any consistency rule, then forward-test on a simulator for weeks before any paid evaluation.
Know a trader learning this strategy? Send them this breakdown. It's free for them too.
Disclosures
Education only. This page explains how a widely known, public strategy is defined and how you could test it yourself. It is not advice, not a recommendation to trade any contract, size or strategy, and not a signal: it shows no setup for any future session. Charts are real past sessions, chosen to show the rules (including a day they failed); they are selected examples, not typical results. The charts are TradingView snapshots (MNQ1!, regular trading hours, one-minute unless the caption says otherwise; a volume profile, where shown, is TradingView's built-in Fixed Range Volume Profile); diagrams labelled as illustrations are drawn by Tarrow Futures and are not market data. The level, range, entry, stop and target marks and labels on them were added by Tarrow Futures. Bars may differ slightly from those on your platform. Trade outcomes on this page are what the written rules would have done on those days, before commissions and slippage. They are not trades Tarrow Futures placed. Dollar figures for sequences and rules are example figures, not results. Prop firm rules differ and change; your firm's current rulebook decides. Futures trading involves substantial risk of loss. Automation does not remove risk.
CFTC Rule 4.41: Hypothetical or simulated performance results have certain limitations. Unlike an actual performance record, simulated results do not represent actual trading. Also, since the trades have not been executed, the results may have under- or over-compensated for the impact, if any, of certain market factors, such as lack of liquidity. Simulated trading programs in general are also subject to the fact that they are designed with the benefit of hindsight. No representation is being made that any account will or is likely to achieve profit or losses similar to those shown.