Home / Blog / Strategy Testing & Automation
Strategy Testing & Automation
What is a liquidity sweep in trading?
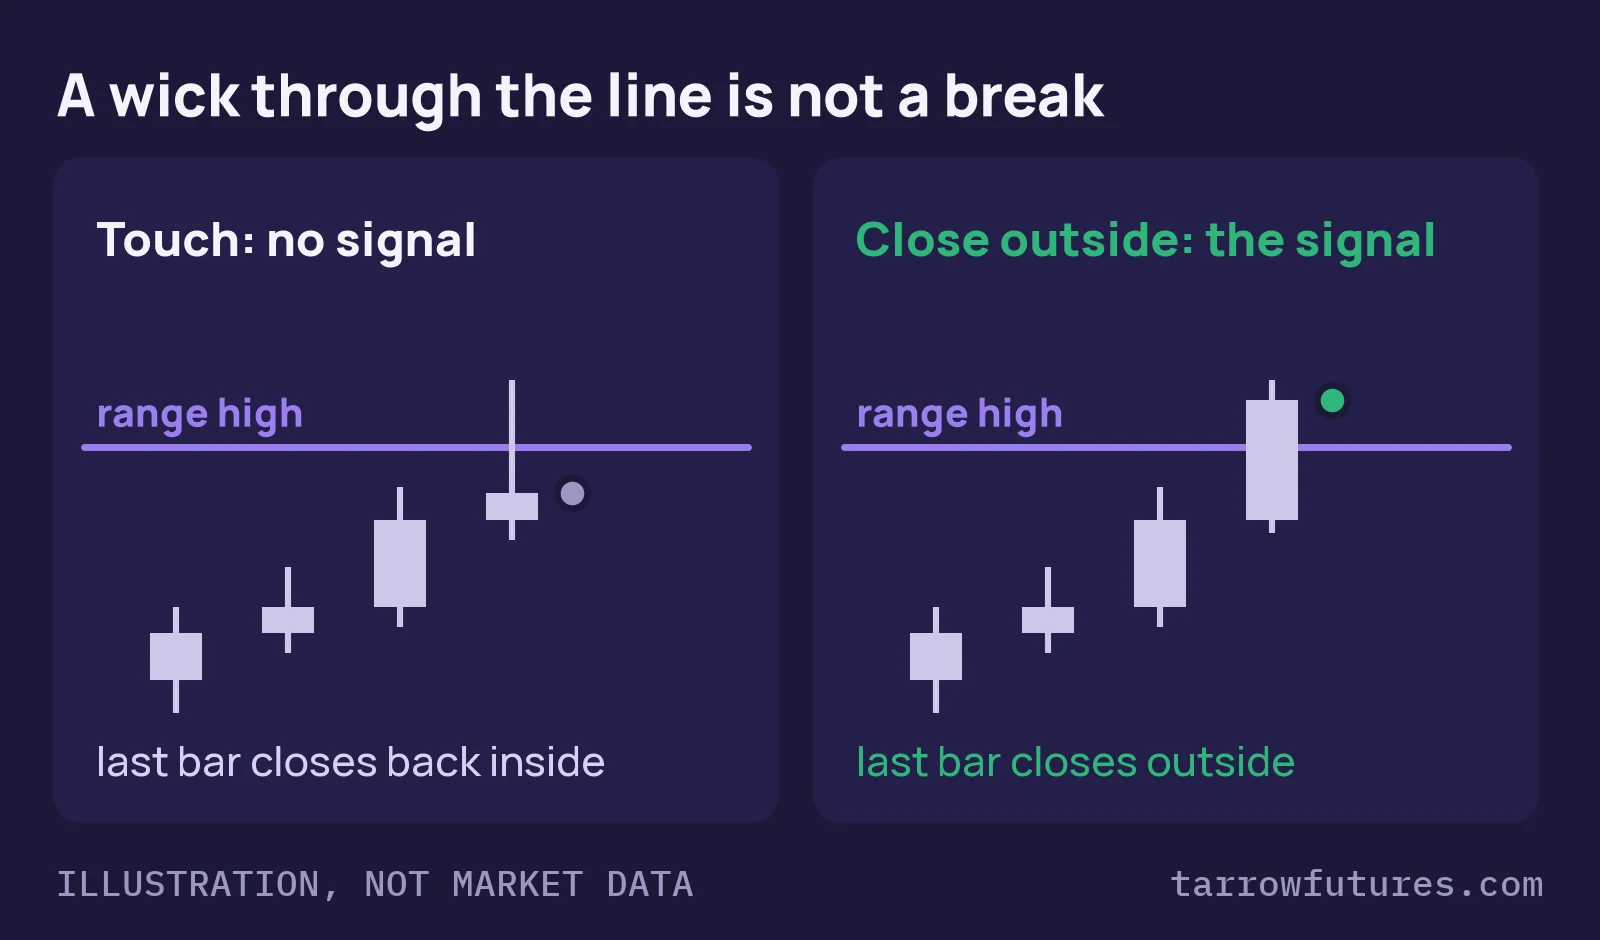
A liquidity sweep is when price trades through an obvious level, such as the morning high or yesterday's low, and then closes back on the side it came from. The wick goes through the level; the close doesn't. It happens at obvious levels because that is where resting orders sit: stops on one side, breakout entries on the other. Price reaching them fills them, and if nothing follows, the bar closes back inside.
On 1 October 2026, MNQ swept its morning high twice in fifteen minutes without a single 5-minute close above it. That day is the example below.
Free strategy breakdown · free with your email
Liquidity sweep reversal breakdown
The rule card, a real MNQ sweep that reached its target, and one stopped by a second sweep.
✓ It's yours. The link is on its way to your inbox. Open the liquidity sweep reversal breakdown now
Read the free overview firstSweep, break, fake breakout: three different events
The same level can produce three different events, and the difference is in the close:
| Event | What the bar does at the level | Closed beyond it? |
|---|---|---|
| Liquidity sweep | Trades through, closes back inside | No |
| Breakout | Closes beyond, and later bars stay beyond | Yes, and it holds |
| Fake breakout | Closes beyond, then a bar closes back inside within a few bars | Yes, briefly |
Under a close-based rule, a sweep is never a breakout, however far the wick reached. That is the point of waiting for the close. For the third row, see what is a fake breakout, with six real opening ranges.
Why sweeps happen at obvious levels
Think about where orders rest. Traders short from below a morning high often keep their stop just above it. Breakout traders often keep a buy-stop entry just above it too. Both are buy orders sitting a few ticks beyond a level everyone can see.
When price trades up into that level, those orders fill. Filling them takes buying, and that can push price a few points through. What happens next depends on whether new buyers keep coming. If they don't, the bar closes back below the level, and the wick is all that's left.
That is a description of where orders sit, not a claim about who moved the price. You'll read stronger stories online. We don't need them to use the idea, and we can't verify them.
Free strategy breakdownSee it on real charts: the liquidity sweep reversal breakdown has the rule card, a day it worked and a day it failed.Get it ↓A real example: 1 October 2026, MNQ, 5-minute bars
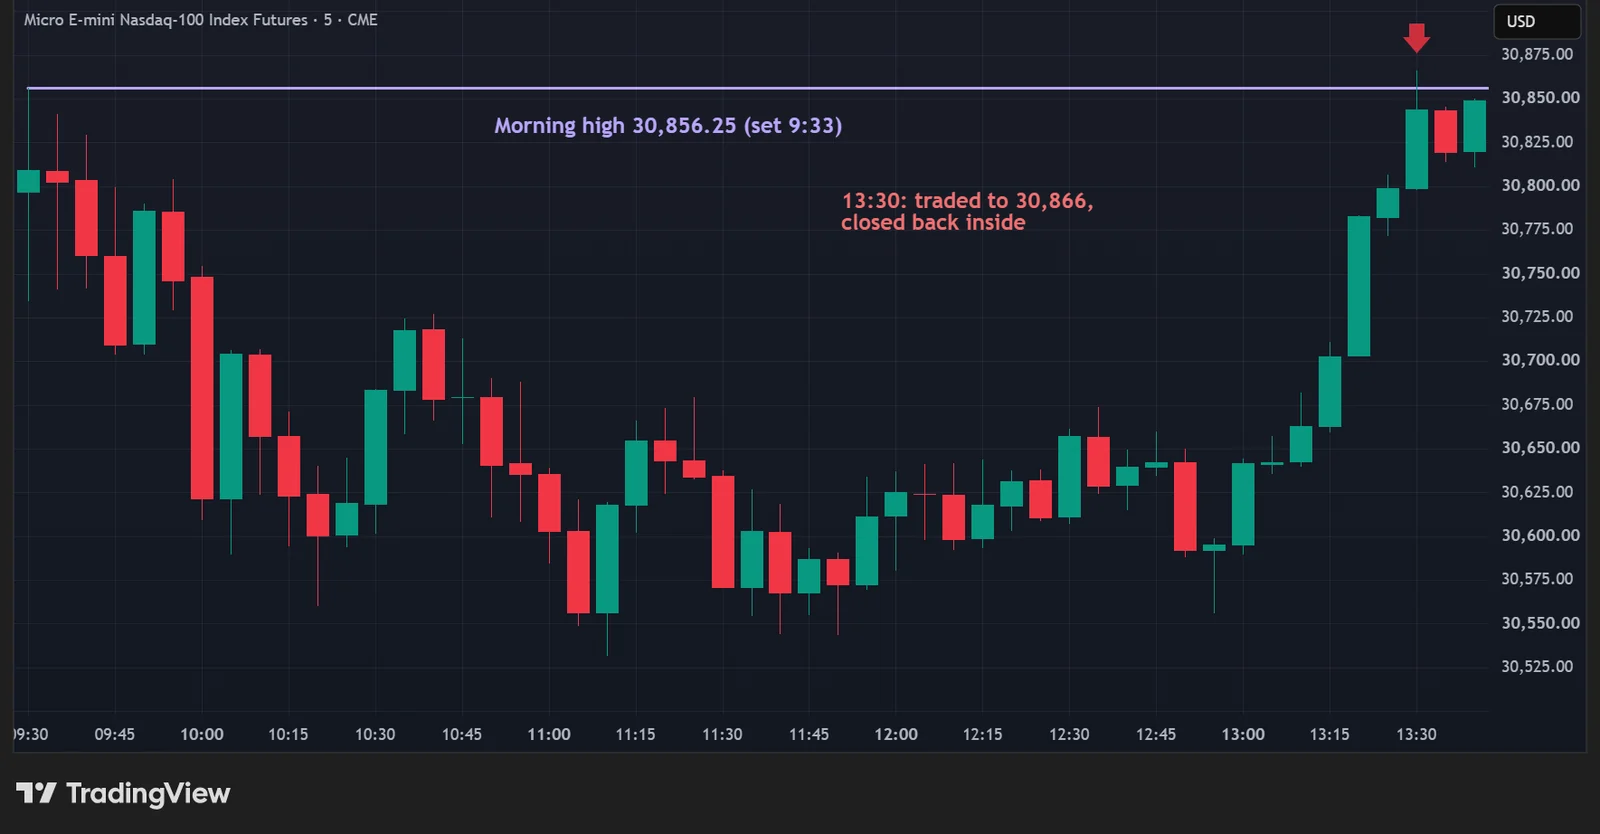
The morning high was 30,856.25, set in the first five minutes of the session. Price fell away from it, closed every 5-minute bar between 30,556.50 and 30,657 from 11:00 to 13:00 ET, and rallied back after that.
- The
13:30bar traded up to30,866, 9.75 points through the high, and closed at30,843.75, back below it.
- The
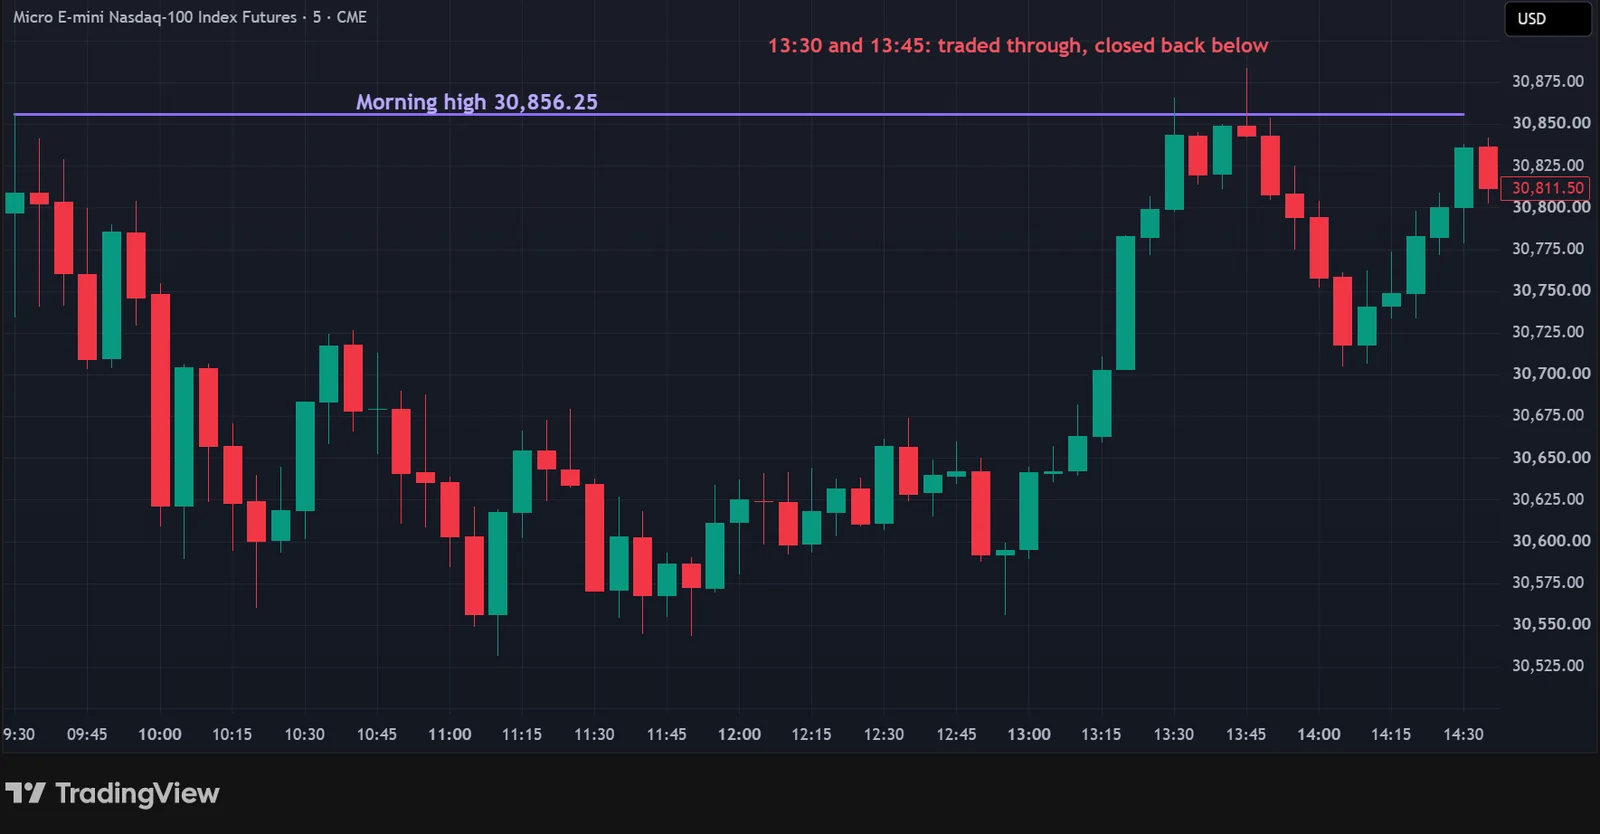
13:45bar did it again: up to30,883.50, 27.25 points through the high, and closed at30,843.25. - No 5-minute bar closed above
30,856.25through14:30.
Two trips through the same level, 9.75 and 27.25 points deep, and no close beyond it. Someone with a buy-stop at 30,860 got filled twice; someone whose rule waited for a close never entered. This day was selected to show the idea, not as a typical result. Many days, price trades through a level and keeps going.
How close-based rules treat a sweep
Because the close decides, writing the rules down turns a confusing wick into a clear event:
- The level. Which high or low? The morning high, the opening range, yesterday's high: pick one and define it in times (for example,
9:30to10:00ET). - What counts as a break. A bar that closes beyond the level, on a stated bar size. On a 1-minute chart and a 5-minute chart the same move can be a sweep on one and a break on the other, so the bar size is part of the rule.
- What counts as a rejection. Some strategies trade the sweep itself: a bar opens inside, trades through, closes back inside, and the stop goes beyond the sweep's extreme. That is the shape of the prior-day high/low strategy. It is a worked example of rules, not evidence that it is profitable; test any version on many sessions, with costs.
- How many attempts. On 1 October the level was swept twice in fifteen minutes. A rule that allows one attempt per level per day treats that very differently from one that re-enters every time.
Sweeps and prop account risk
In a prop account the danger isn't the sweep; it's re-entering into it. A trader who buys every push through the high on a day like 1 October takes two entries in fifteen minutes at the same level. Size each one from its stop: contracts = the money you allow per trade ÷ (stop distance in points × the point value), rounded down; on MNQ the point value is $2. Then cap the attempts so two sweeps can't become five losses against your daily loss limit.
For a full rule set that trades the sweep of the morning range, with this same 1 October session as its failed example, read the liquidity sweep strategy. For the version that trades the rejection at yesterday's high or low, with the stop, target, time window and sizing, read the prior-day high/low strategy. For the case where price does close beyond the level, see the opening range breakout strategy.
Educational only. Not financial advice. Charts: TradingView snapshots of MNQ1! 5-minute bars, 1 October 2026; every price in this post was read from TradingView's bars for that session. Past session selected to show the idea, not a typical result.
Free strategy breakdown · free with your email
Liquidity sweep reversal breakdown
The rule card, a real MNQ sweep that reached its target, and one stopped by a second sweep. We email you the link, so it is one tap away next time.
✓ It's yours. The link is on its way to your inbox. Open the liquidity sweep reversal breakdown now
Read the free overview firstQuestions
What is a liquidity sweep?
Price trades through an obvious level, such as a prior high or low, then closes back on the side it came from. The wick goes through the level; the close does not. Traders also call it a stop run or a liquidity grab.
Why do liquidity sweeps happen at obvious highs and lows?
Because that is where resting orders tend to sit. Stop-losses of traders on the other side and breakout entry orders often rest just beyond a level everyone can see. When price trades through, those orders fill. If no new buying or selling follows, price can close back inside. This describes where orders sit, not who moved the price.
What is the difference between a liquidity sweep and a fake breakout?
Under a close-based rule, a sweep never counts as a break, because no bar closed beyond the level. A fake breakout did close beyond the level, then closed back inside within a few bars. Both end back inside; only the fake breakout ever closed outside.
Is a liquidity sweep a buy or sell signal?
Not on its own. Some strategies trade the rejection back inside, with a stop beyond the sweep's extreme, but every version needs its own rules and its own test with costs. One chart, including the one in this post, shows the idea, not that it works.
How do you trade around a sweep in a prop account?
Decide where the stop goes before the level is touched, size from that stop and the account's daily loss limit, and set how many attempts you allow at the same level. Two sweeps in fifteen minutes, like the example here, can be two stopped trades for someone who keeps re-entering.
Educational material only. Not financial, investment or trading advice, and not a recommendation to trade any contract or size. Prop firm rules differ and change; the current rulebook of the firm you use decides. Worked examples use example figures, not results. Futures trading involves substantial risk of loss. Evaluations are paid tests and most people who take one do not pass.