Home / Blog / Strategy Testing & Automation
Strategy Testing & Automation
What is a fake breakout, and can you tell one from a real breakout?
A fake breakout is a break of a level that doesn't last: a bar closes outside a range, then price closes back inside within a few bars, often running through the range the other way. A real breakout closes outside and stays outside. On the six real MNQ mornings below, three of each, the breakout bars looked alike; what separated them happened in the next one to five bars. That is the honest answer to "how do you spot a fake breakout": at the moment of the break you usually can't, so the rules decide in advance what counts as a failure and what it is allowed to cost.
All six sessions use the same level: the opening range, the high and low of 9:30 to 10:00 ET (8:30 to 9:00 CT) on the MNQ 1-minute chart. The break is the first 1-minute close outside that range after 10:00.
Free strategy breakdown · free with your email
Opening range breakout breakdown
The rule card, two real MNQ sessions (one target, one stop) and how to size it under a trailing drawdown.
✓ It's yours. The link is on its way to your inbox. Open the opening range breakout breakdown now
Read the free overview firstWhat counts as held, and what counts as a trap
Before looking at any chart, write the definitions down. Ours, for this post:
| Term | Definition used here |
|---|---|
| Break | The first 1-minute bar after 10:00 ET that closes at least 5 points outside the opening range |
| Held | No 1-minute bar closes back inside the range for the next 30 bars |
| Trap | A bar closes back inside the range within 5 bars of the break |
The 5-point minimum is there so the break is visible on the chart. These are definitions for comparing charts, not a trading strategy. Other traders use a different range length, a different number of bars, or a percentage of the range; what matters is that the definition exists before the break, not after it.
Pair 1: two breaks above the range, one day apart
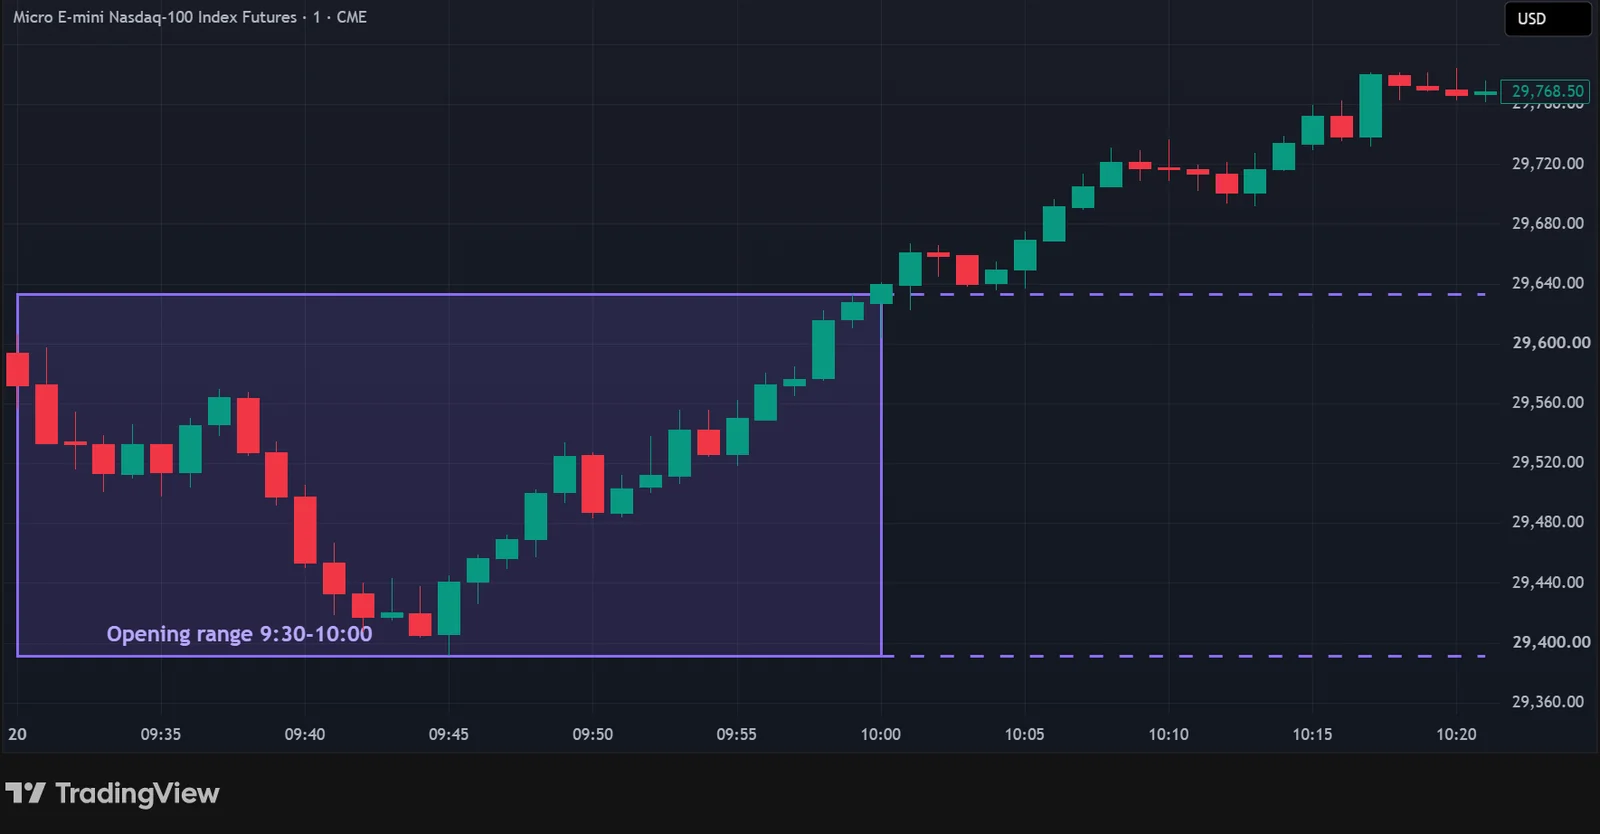
On 20 October 2026 the opening range ran from 29,391.25 to 29,633, a 241.75-point range. The 10:00 bar closed at 29,639.75, 6.75 points above the high. No bar closed back inside for the next 30 minutes.
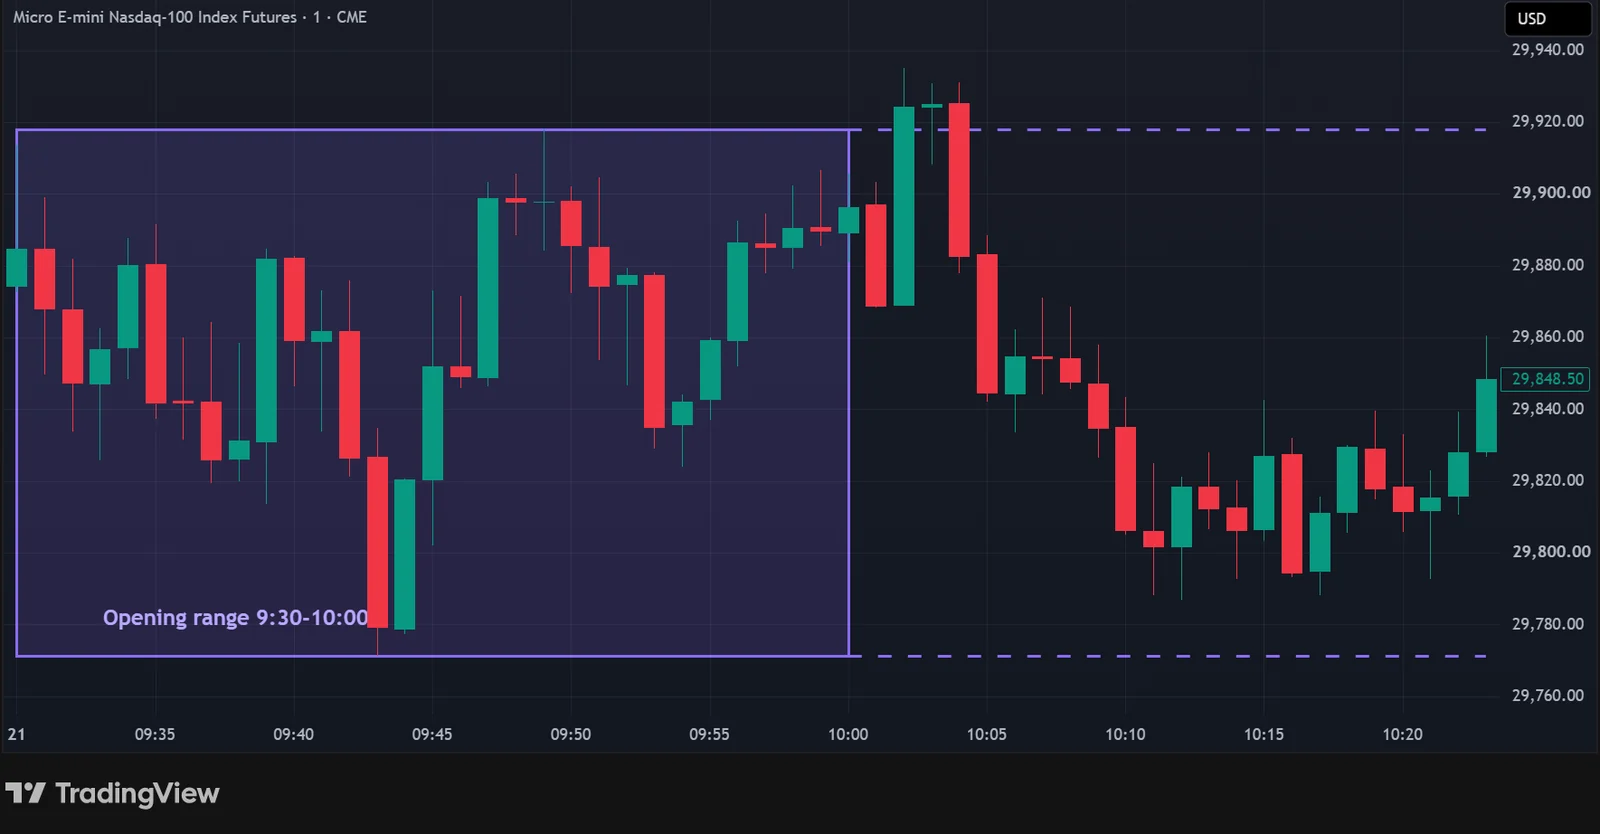
On 21 October the range ran from 29,771.25 to 29,918 (146.75 points). The 10:02 bar closed at 29,924.25, 6.25 points above the high. Two bars later, at 10:04, a bar closed back inside at 29,882.75, and price went on through the range.
Both breaks came within two minutes of 10:00, and both closed between 6 and 7 points outside the range. Nothing in the breakout bar itself told you which one would hold.
Pair 2: two breaks below the range
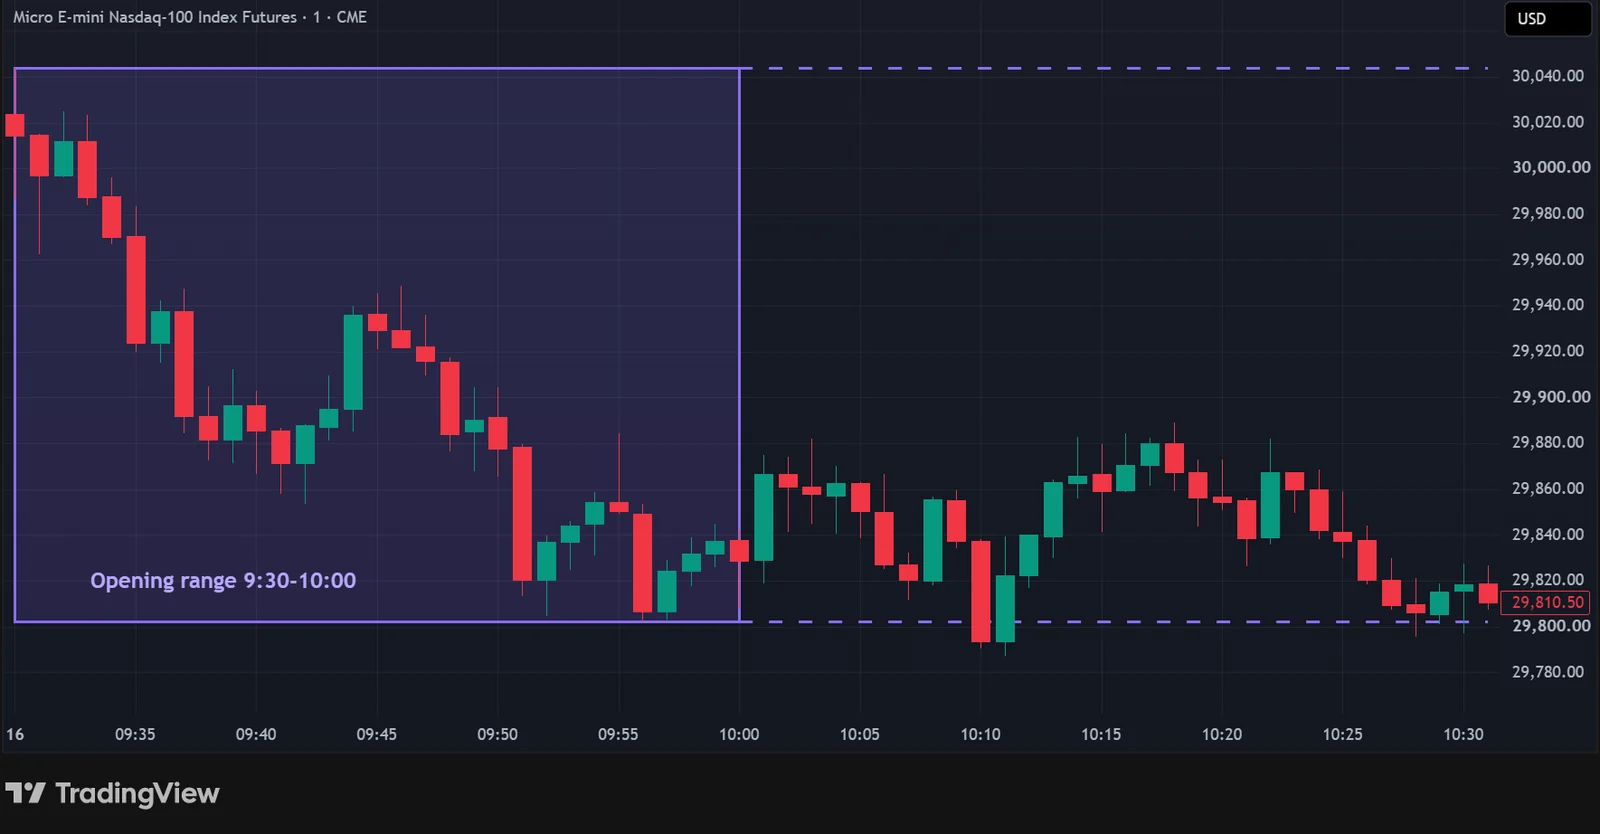
On 16 October the range ran from 29,802.25 to 30,043.75 (241.5 points). The 10:10 bar closed at 29,793.75, 8.5 points below the low. The very next bar, 10:11, closed back inside at 29,822.25.
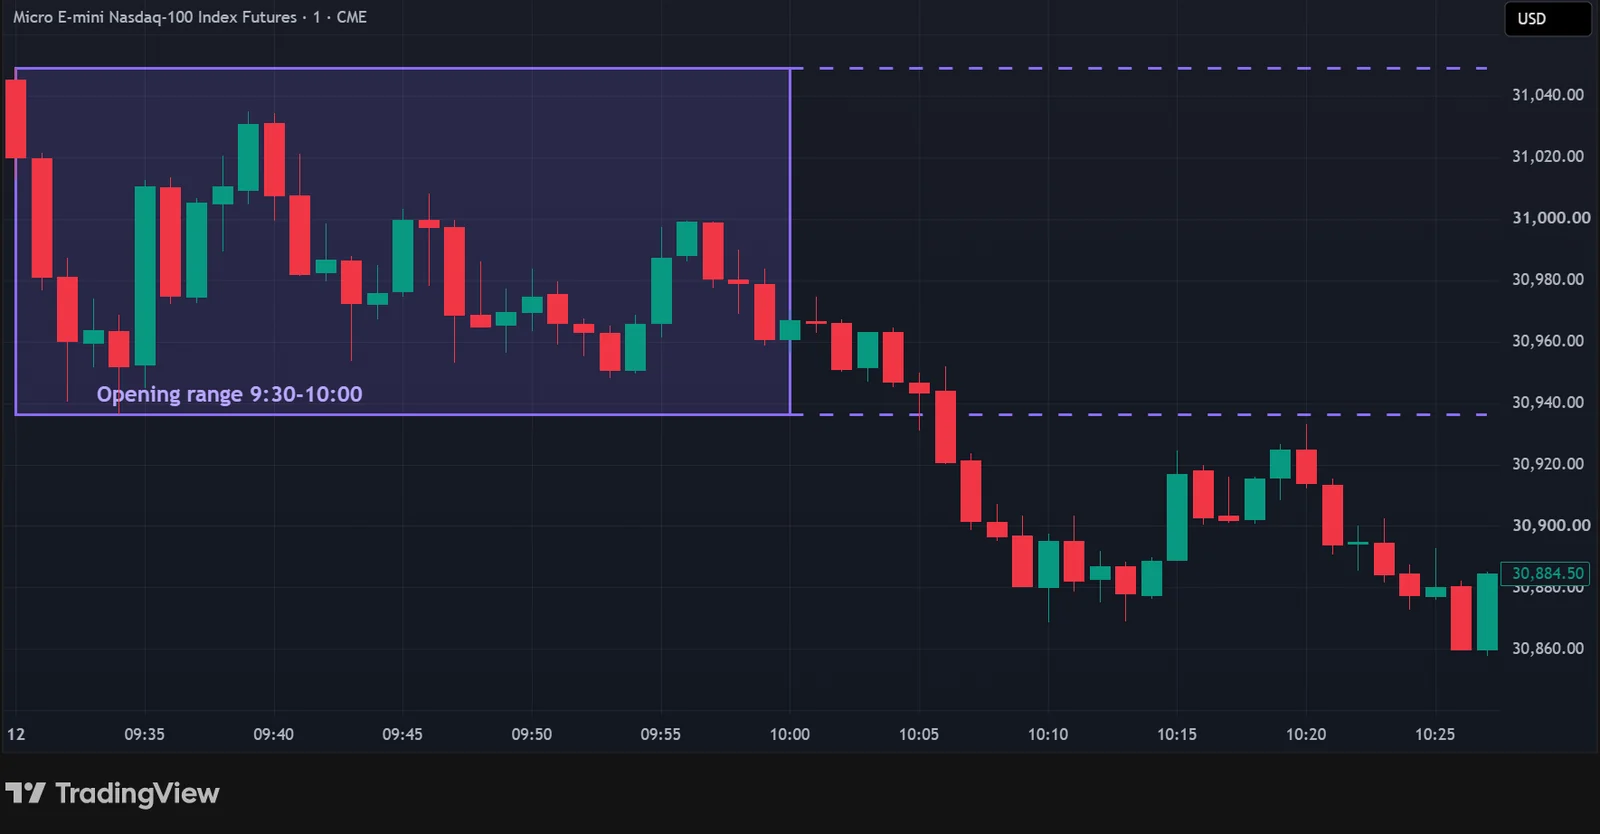
On 12 October the range ran from 30,936.25 to 31,049 (112.75 points). The 10:06 bar closed at 30,920.75, 15.5 points below the low, and no bar closed back inside for the next 30 minutes.
Pair 3: an early break and a late one
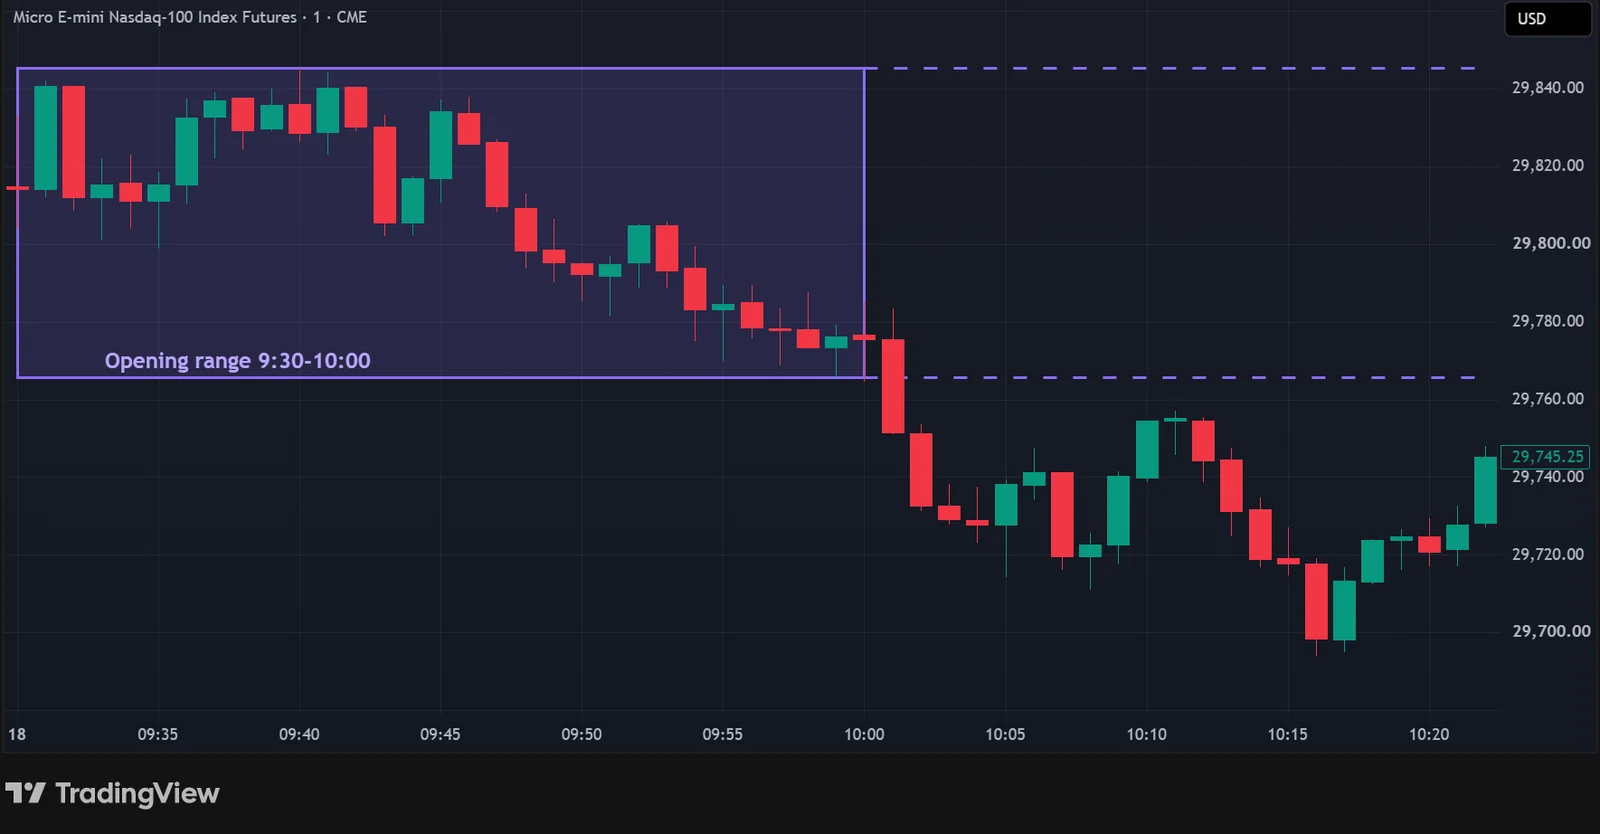
On 18 September the range ran from 29,765.75 to 29,845.25 (79.5 points). The 10:01 bar closed at 29,751.50, 14.25 points below the low, and stayed outside.
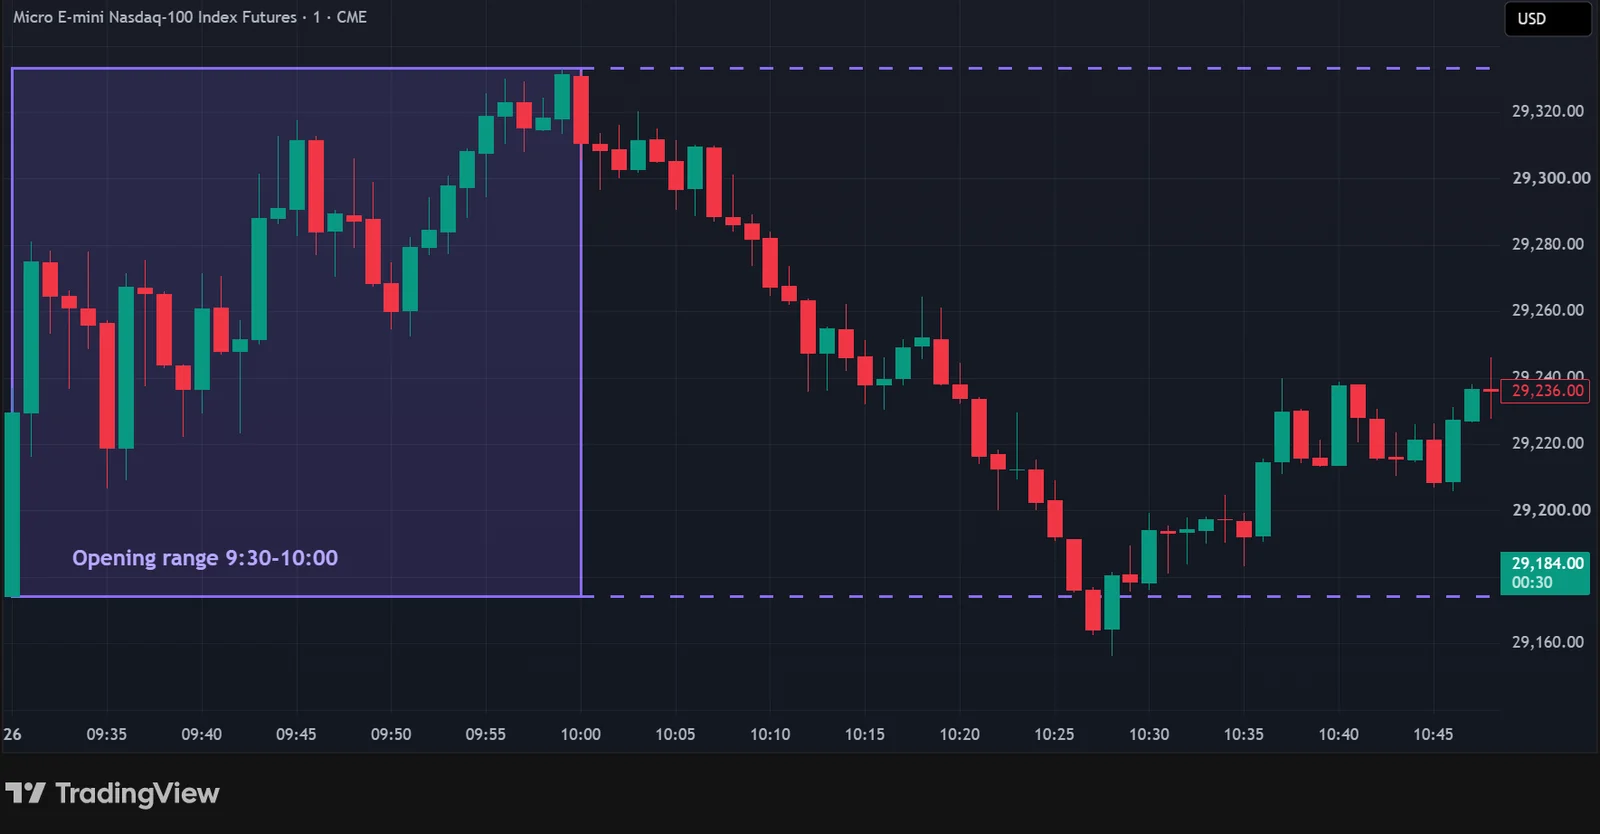
On 26 August the range ran from 29,174.25 to 29,333.25 (159 points). The first close below came late, at 10:27 (29,164.25, 10 points below the low), and the 10:28 bar closed back inside at 29,180.50.
These six were selected to show the idea, not as a typical result. They are not a sample you can draw a rule from.
So what does separate a fake breakout from a real one?
On these six, not the obvious things:
| Session | Result | Break time (ET) | Close outside the range | Range size |
|---|---|---|---|---|
| 20 Oct | Held | 10:00 |
6.75 pts | 241.75 pts |
| 21 Oct | Trap | 10:02 |
6.25 pts | 146.75 pts |
| 12 Oct | Held | 10:06 |
15.5 pts | 112.75 pts |
| 16 Oct | Trap | 10:10 |
8.5 pts | 241.5 pts |
| 18 Sep | Held | 10:01 |
14.25 pts | 79.5 pts |
| 26 Aug | Trap | 10:27 |
10 pts | 159 pts |
- Distance outside the range: a trap closed 10 points out; a break that held closed 6.75 points out.
- Time of the break: two of the three that held broke within two minutes of
10:00, but so did one trap. - Range size: the largest range held on one day and trapped on another.
Six sessions can't show that any of these is a filter, and we are not claiming one. If you want to test one (a minimum close distance, a cut-off time, a maximum range), test it on hundreds of sessions, with commissions and slippage, before trusting it. Until then, the useful lesson is the one every chart above shows: a close outside is a question, and the next few bars answer it.
Plan the trap before the break
Because a break can't be sorted at the moment it happens, most breakout rule sets settle three things in advance:
- What "wrong" looks like. For example, a close back inside the range within a set number of bars. That is the exit, decided before the entry.
- Where the stop goes, and the size from the stop. Contracts = the money you allow per trade ÷ (stop distance in points × the contract's point value), rounded down. On MNQ the point value is $2, so a 40-point stop is $80 a contract before costs. See how many contracts to trade in a prop account.
- How many attempts a day. A trap followed by a re-entry, followed by another, is how one bad morning eats a daily loss limit. Many rule sets allow one or two breakout attempts a day.
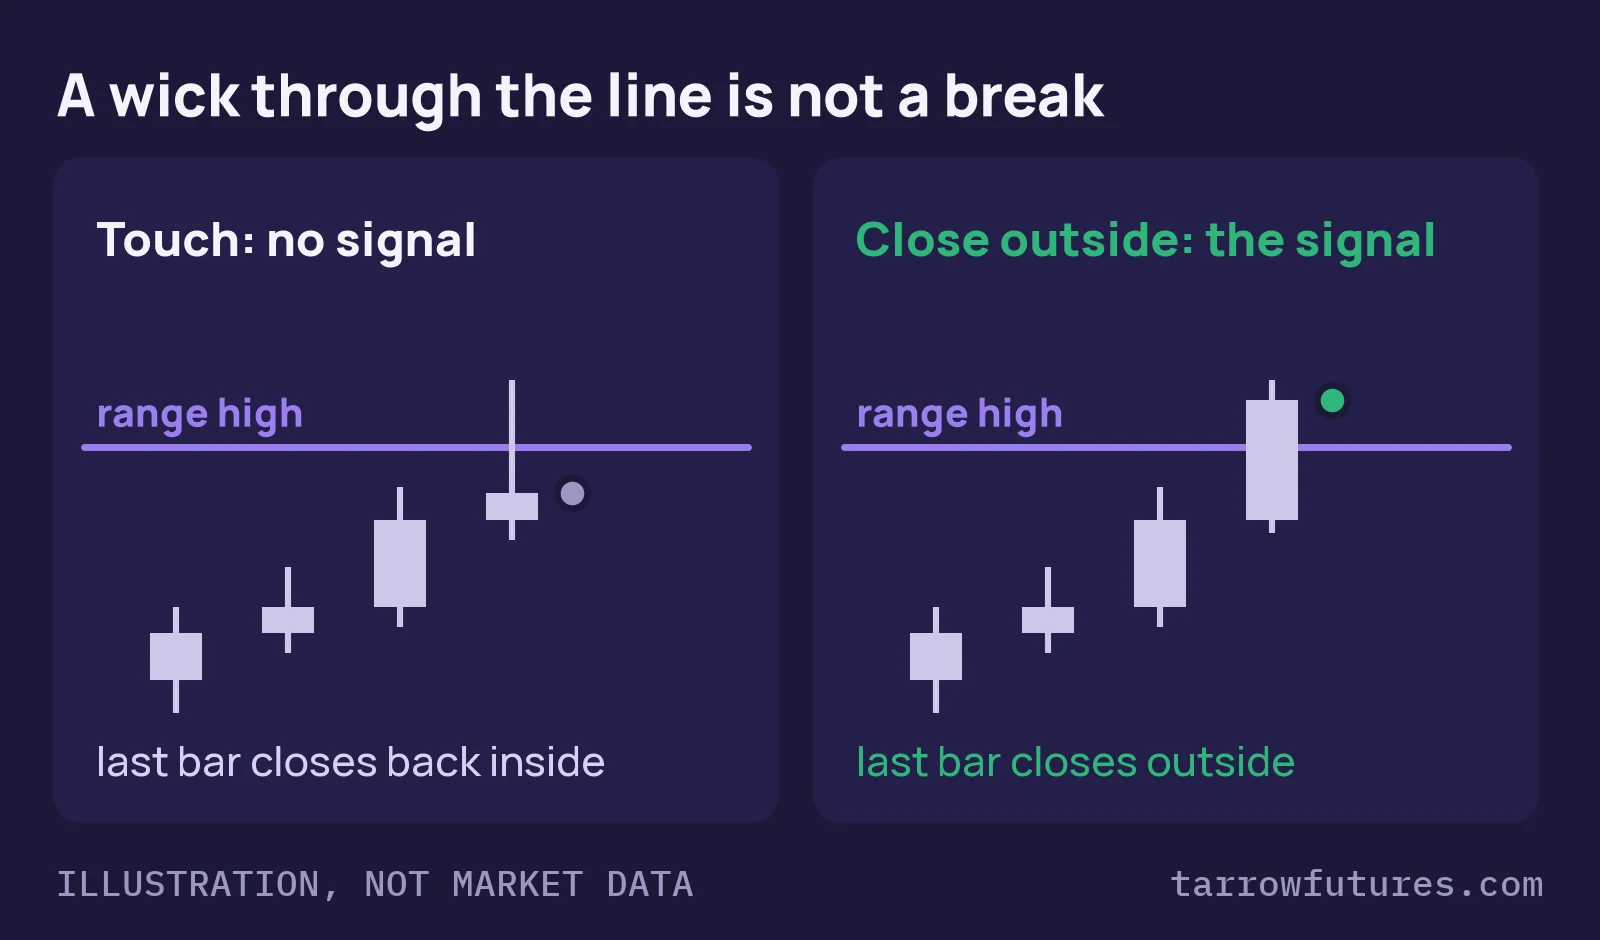
A wick through the level that closes back inside is a different event again. It never closed outside, so under a close-based rule it was never a break. That is the liquidity sweep side of the same level, and the picture at the top of this post shows the difference.
For the full rule set built on this level, including the range, the stop, the exit and the sizing, read the opening range breakout strategy, and for the version that waits for price to come back and test the level, the break and retest strategy.
Educational only. Not financial advice. Charts: TradingView snapshots of MNQ1! 1-minute bars; every price in this post was read from TradingView's bars for that session. Past sessions selected to show the idea, not a typical result.
Free strategy breakdown · free with your email
Opening range breakout breakdown
The rule card, two real MNQ sessions (one target, one stop) and how to size it under a trailing drawdown. We email you the link, so it is one tap away next time.
✓ It's yours. The link is on its way to your inbox. Open the opening range breakout breakdown now
Read the free overview firstQuestions
What is a fake breakout?
A break of a level that doesn't last. Price closes outside a range, high or low, then closes back inside within a few bars, often moving through the range the other way. Traders also call it a false breakout, a failed breakout, or a bull trap or bear trap depending on the direction.
How can you tell a fake breakout from a real one?
Usually not at the moment of the break. On the six MNQ sessions in this post, the bar that broke out looked alike in all six; the difference only showed in the next one to five bars. That is why rule sets define in advance what counts as a failed break (for example, a close back inside within a set number of bars) and put the stop where that would be wrong.
Is a wick through a level a breakout?
Not under a close-based rule. A wick that pokes through a level and closes back inside is a different event, often called a liquidity sweep. Most breakout rules wait for a bar to close outside the level.
Does a bigger close outside the range mean the breakout will hold?
Not on these six sessions. One of the traps closed 10 points outside the range and one of the breakouts that held closed only 6.75 points outside. Six examples can't establish a rule either way; test any filter on many sessions, with costs, before trusting it.
How do prop traders handle fake breakouts?
By deciding the risk before the break. The stop sits where the breakout would be wrong, the size comes from the stop distance and the account's daily loss limit, and the number of attempts per day is capped, so a trap costs one planned loss instead of a string of re-entries.
Educational material only. Not financial, investment or trading advice, and not a recommendation to trade any contract or size. Prop firm rules differ and change; the current rulebook of the firm you use decides. Worked examples use example figures, not results. Futures trading involves substantial risk of loss. Evaluations are paid tests and most people who take one do not pass.