Home / Resources / Strategy library / Opening drive
Strategy library · Education only
Opening drive: the first 30 minutes pick the direction.
Some sessions push one way from the open and finish the first half hour near the extreme. The opening drive strategy trades in that direction from 10:00, with the stop in the middle of the range. Here are the rules, two real MNQ sessions, and how to size a stop that changes every day.
Unlocked. Your link is on its way by email. Jump to the full breakdown ↓
The full breakdown · free with your email
Unlock the full opening drive breakdown
The rule card, two real MNQ sessions (one target, one stop a minute after the entry) and how to size from the stop, not the setup. The free overview is below; we also email you the link, so it is one tap away next time.
What is an opening drive?
An opening drive is a session that moves hard in one direction from the open and keeps going, instead of swinging back and forth while it finds a level. Traders read it from the first half hour of the US cash session: if price spends that half hour pushing one way and finishes near the extreme, the open "drove".
For index futures such as MNQ and NQ, the open means the cash open at 9:30 ET (8:30 CT), even though
the futures trade almost around the clock. That is when volume and range jump.
What is the opening drive strategy?
The opening drive strategy turns that read into rules. It marks the range of the first 30 minutes, checks where the last minute of that half hour closed inside it, and only trades when the close sits near one edge. A close near the high means a long; a close near the low means a short; a close anywhere in the middle means no trade that day. It is a cousin of the opening range breakout, with one difference: it does not wait for price to leave the range. It enters on where the half hour finished.
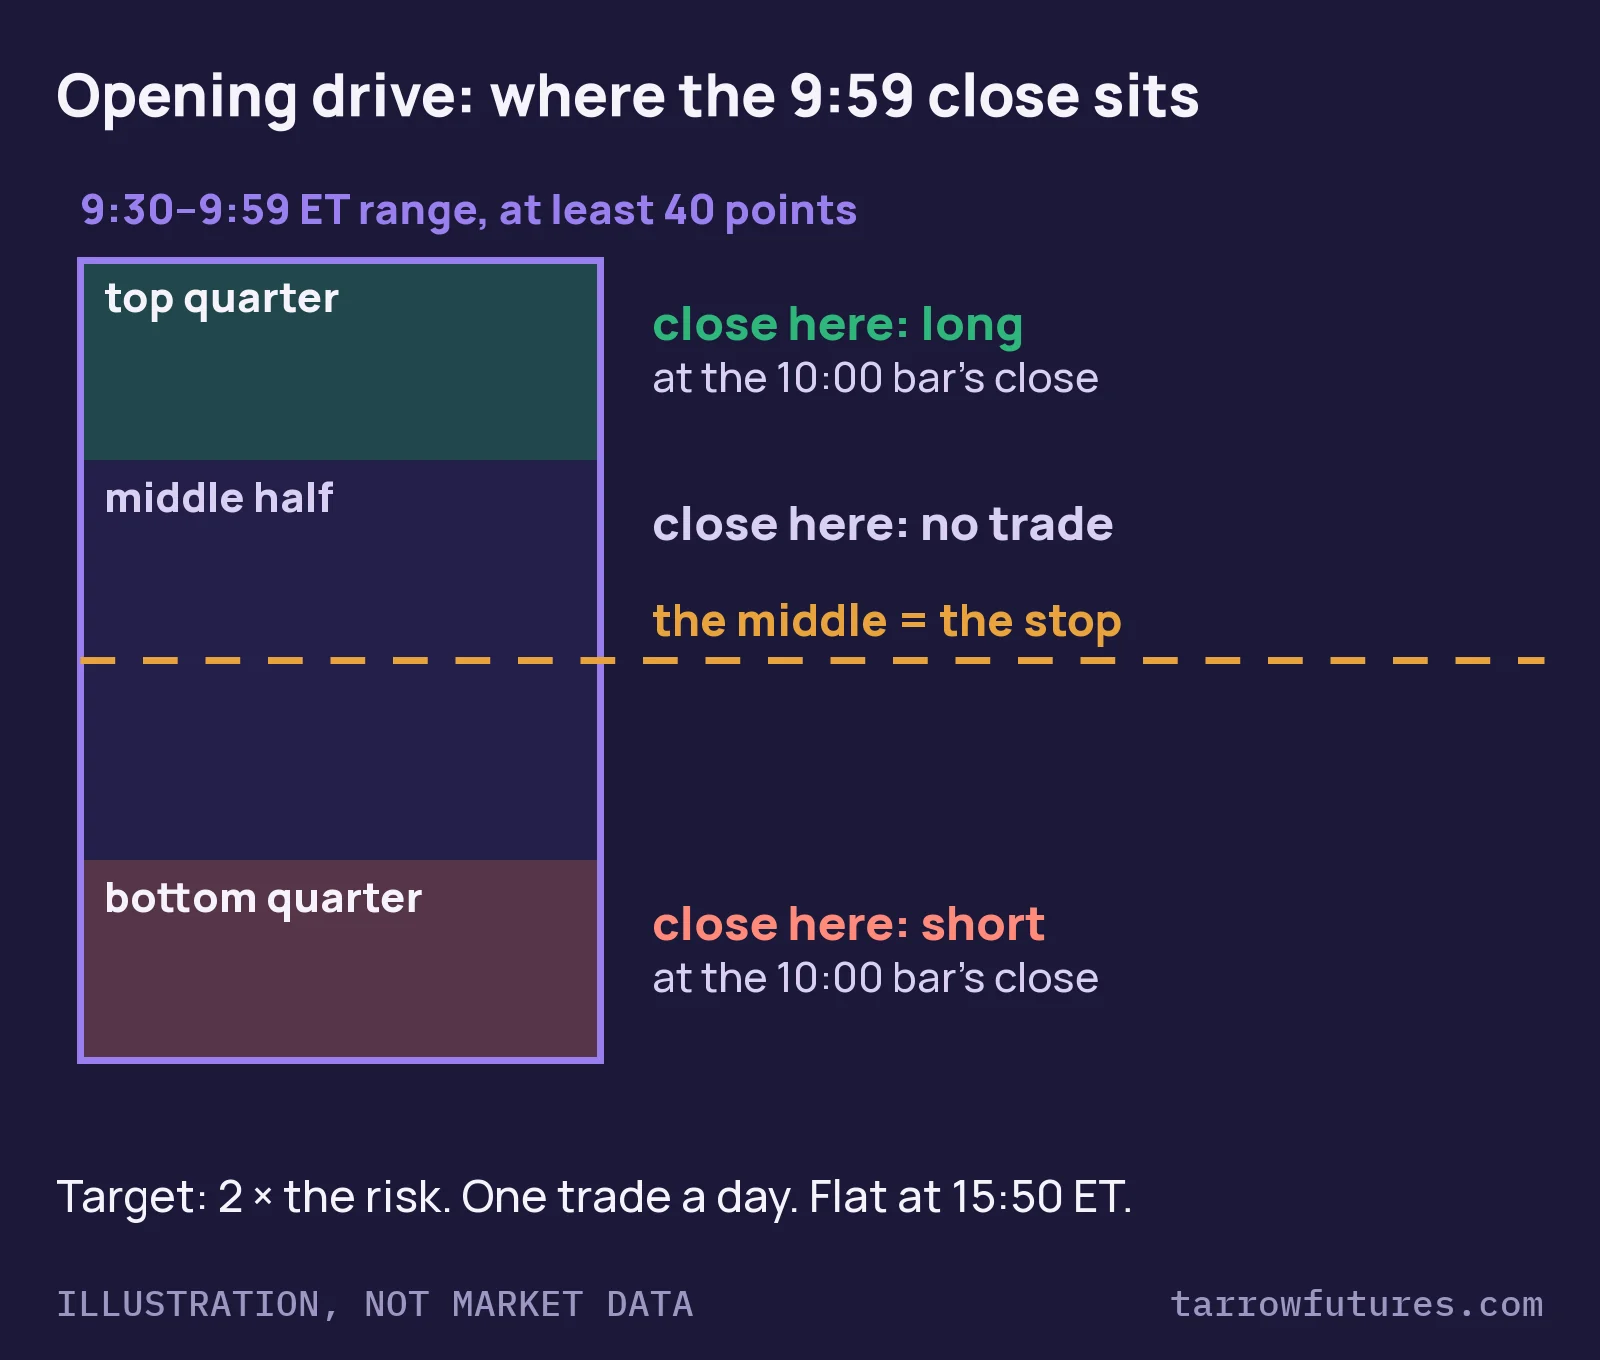
The idea in five lines
- Range: the high and low of the 1-minute bars from
9:30through9:59ET, at least40points wide. - Direction: the
9:59bar's close in the top quarter of the range means long; in the bottom quarter, short. - Entry: the close of the
10:00bar, in that direction. - Stop: the middle of the range.
- Exit:
2 ×the risk, or flat at15:50ET, one trade a day.
Each choice changes the strategy. A quarter is one common cut-off; a third or a fifth is a different strategy. The middle of the range is one common stop; the far side of the range is another, twice as far away. We teach this version as a worked example of the rules; that is not evidence it is profitable.
Why it is hard to trade inside a prop account
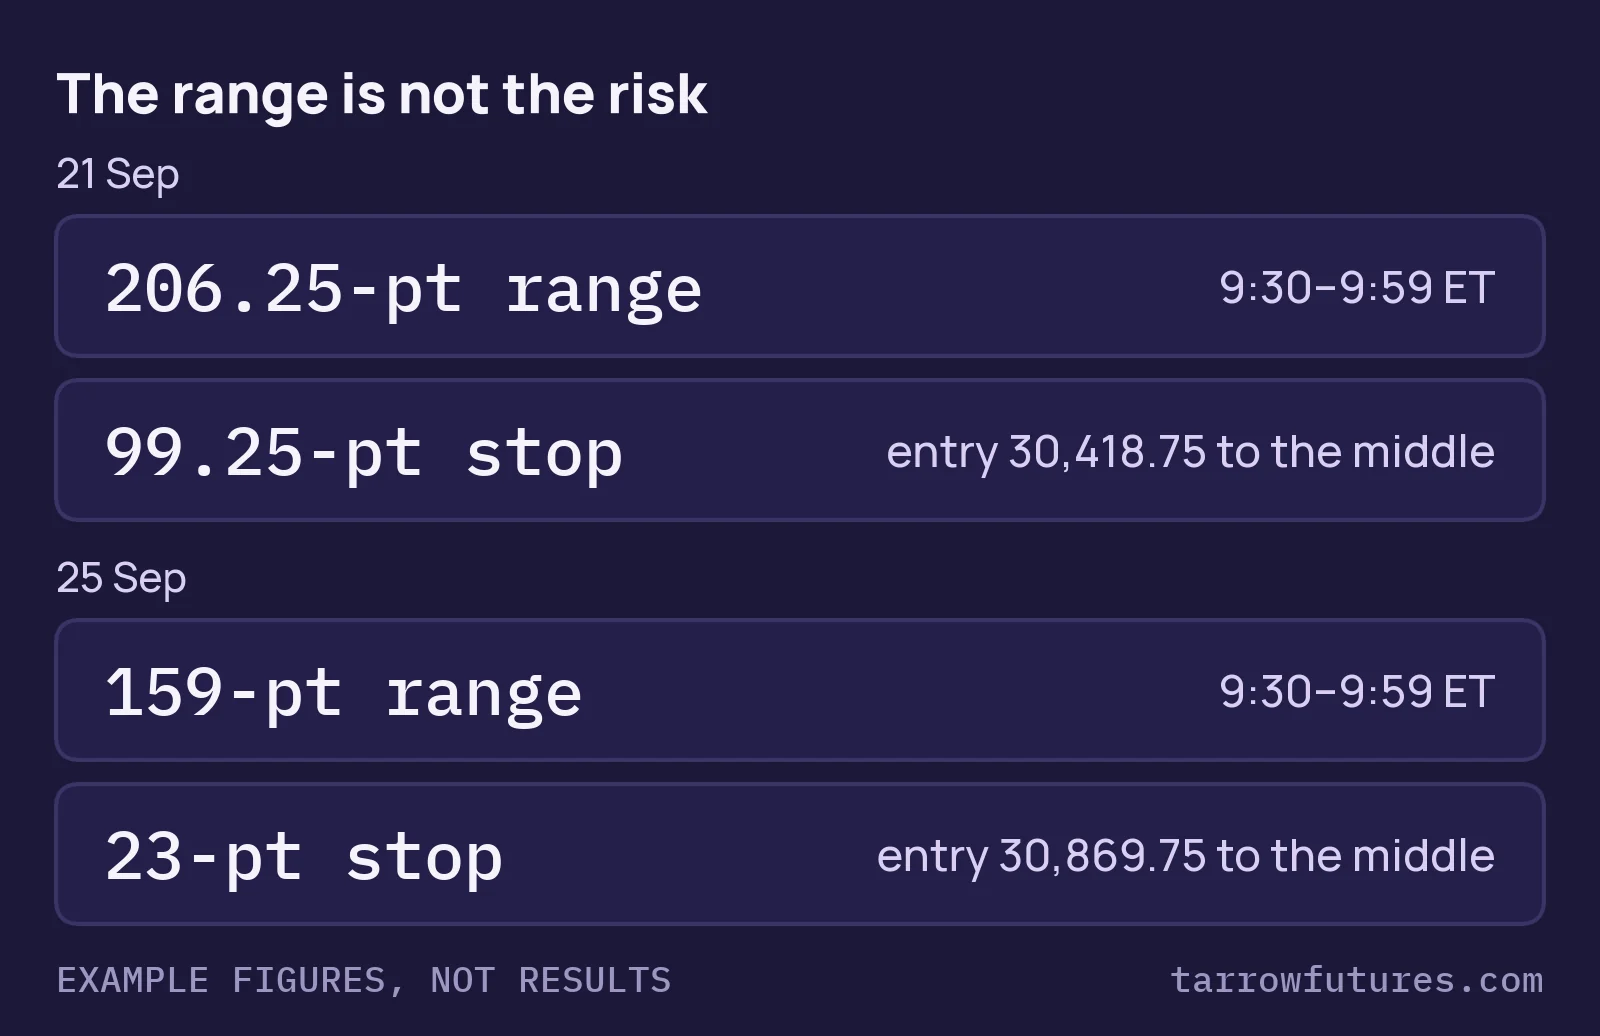
The stop is the distance from the entry to the middle of the range, and that distance moves every day. On the two MNQ
sessions in the full breakdown it was 99.25 points on one day and 23 points on the other, so one
micro contract risked $198.50 and $46. A wide stop eats a daily loss limit; a narrow one invites a
bigger size and can be hit within a minute. Trade a fixed number of contracts and the first half hour quietly decides your
risk for you.
What is in the full breakdown
- The rule cardExact range, direction, entry, stop, target and time rules, written so you could code them.
- A real session where it workedMNQ, 21 Sep 2026, 1-minute chart, step by step.
- A real session where it failedMNQ, 25 Sep 2026: stopped a minute after the entry, and the sizing lesson.
- Prop-rule fitDaily loss limit, trailing drawdown and consistency, worked in numbers.
- A test-it-yourself planHow to backtest and stress-test it before it costs you an evaluation.
The full breakdown · free with your email
Opening drive: rules, real charts, prop-rule fit
Preview below. Unlock it at the top of the page ↑ and it opens here.
1. The rule card
Opening drive, 1-minute bars
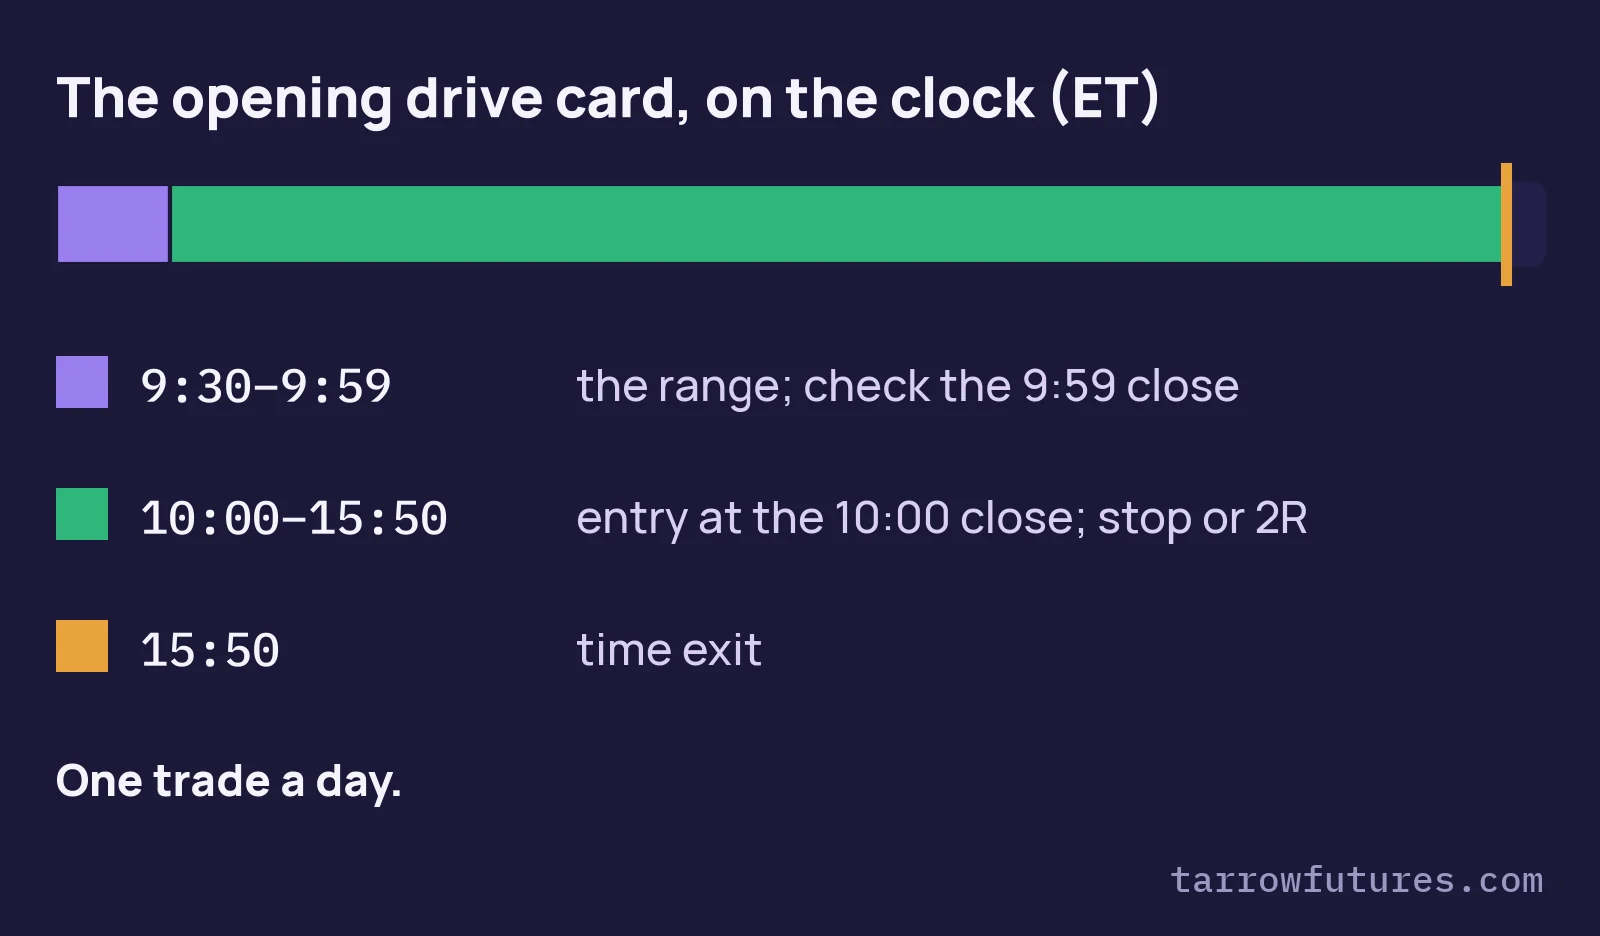
- Range. Mark the highest high and lowest low of the 1-minute bars from
9:30through9:59ET (8:30to8:59CT). If the range is under40points, there is no trade today. - Direction. Look at the close of the
9:59bar, the last minute of the half hour. In the top quarter of the range: long. In the bottom quarter: short. Anywhere in the middle half: no trade today. - Entry. Enter on the close of the
10:00bar, in that direction. If that close is already at or past the middle of the range, there is no trade. - Stop. The middle of the range: (high + low) ÷ 2. If that falls between ticks, round it to the next
0.25away from your entry. - Target. Two times the risk (entry to stop), measured from the entry.
- One trade a day. After a stop or a target, the strategy is done for the day, whatever price does next.
- Time exit. If neither the stop nor the target is reached, exit at
15:50ET. - Size. Contracts = the money you allow per trade ÷ (stop distance in points × the contract's point value), rounded down. If one contract is already more than you allow, there is no trade.
Rule 8 matters because the stop is not the width of the range: it is the distance from the 10:00 close to the
middle, and that can be large or tiny on the same rules. The two examples below show both. Point values come from CME Group's
contract specs: MNQ is $2 a point, NQ $20. Our examples use micros.
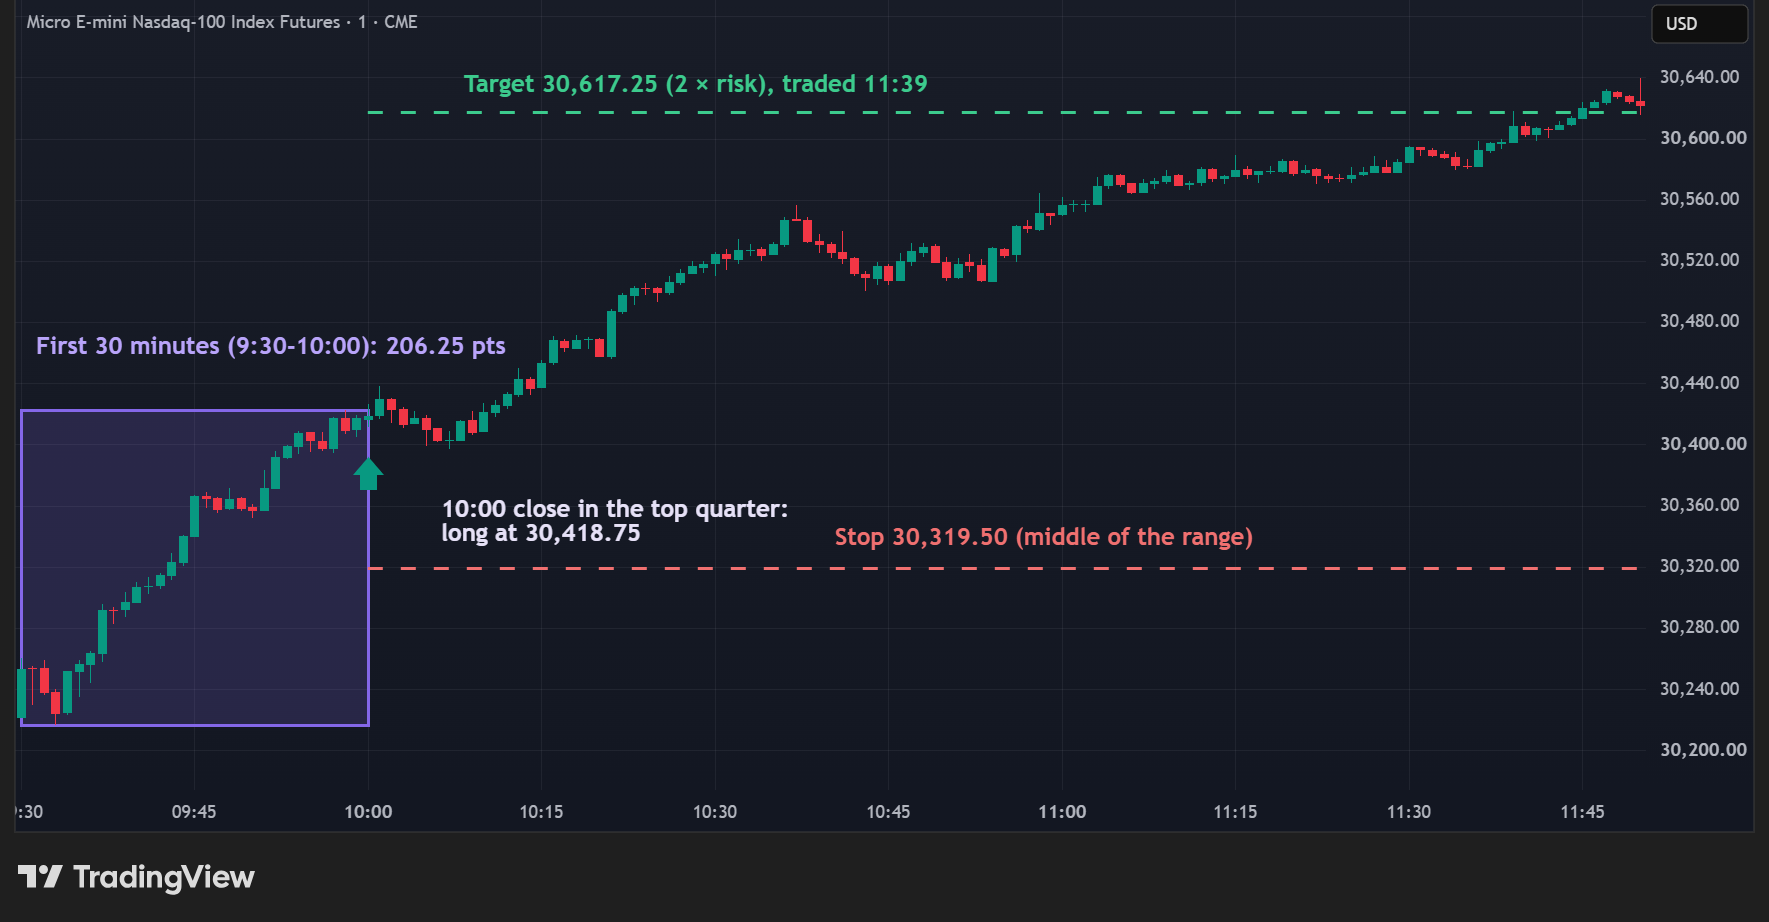
2. A session where the rules worked
Real chartSelected example, chosen to show the rulesTarget reached
| Step | What the chart shows | Number |
|---|---|---|
| Range | High and low of the 9:30–9:59 ET bars | 206.25 pts (at least 40: a drive day is possible) |
| Direction | The 9:59 bar closed in the top quarter of the range | long |
| Entry | Close of the 10:00 bar | 30,418.75 |
| Stop | Middle of the range, 30,319.625, rounded down a tick | 30,319.50, 99.25 pts away |
| Target | Entry + 2 × 99.25 | 30,617.25, 198.5 pts away |
| Outcome | Target traded at 11:39 | risk 99.25 × $2 = $198.50, reward 198.5 × $2 = $397 per MNQ |
Read the chart from left to right. The first half hour climbed across a 206.25-point box and finished near its high, so the rules called it a drive up. The entry is the close of the next bar, the 10:00 bar, and the stop sits at the middle of the box, 99.25 points below. Price dipped after the entry, stayed well above the stop, and the target traded at 11:39, an hour and thirty-nine minutes after the entry. Dollar figures are per micro contract, before commissions and slippage. Hypothetical: what the written rules would have done that day, not a trade anyone placed (CFTC Rule 4.41 notice below the next example).
3. A session where the same rules failed
Real chartSelected example, chosen to show the rulesStopped out
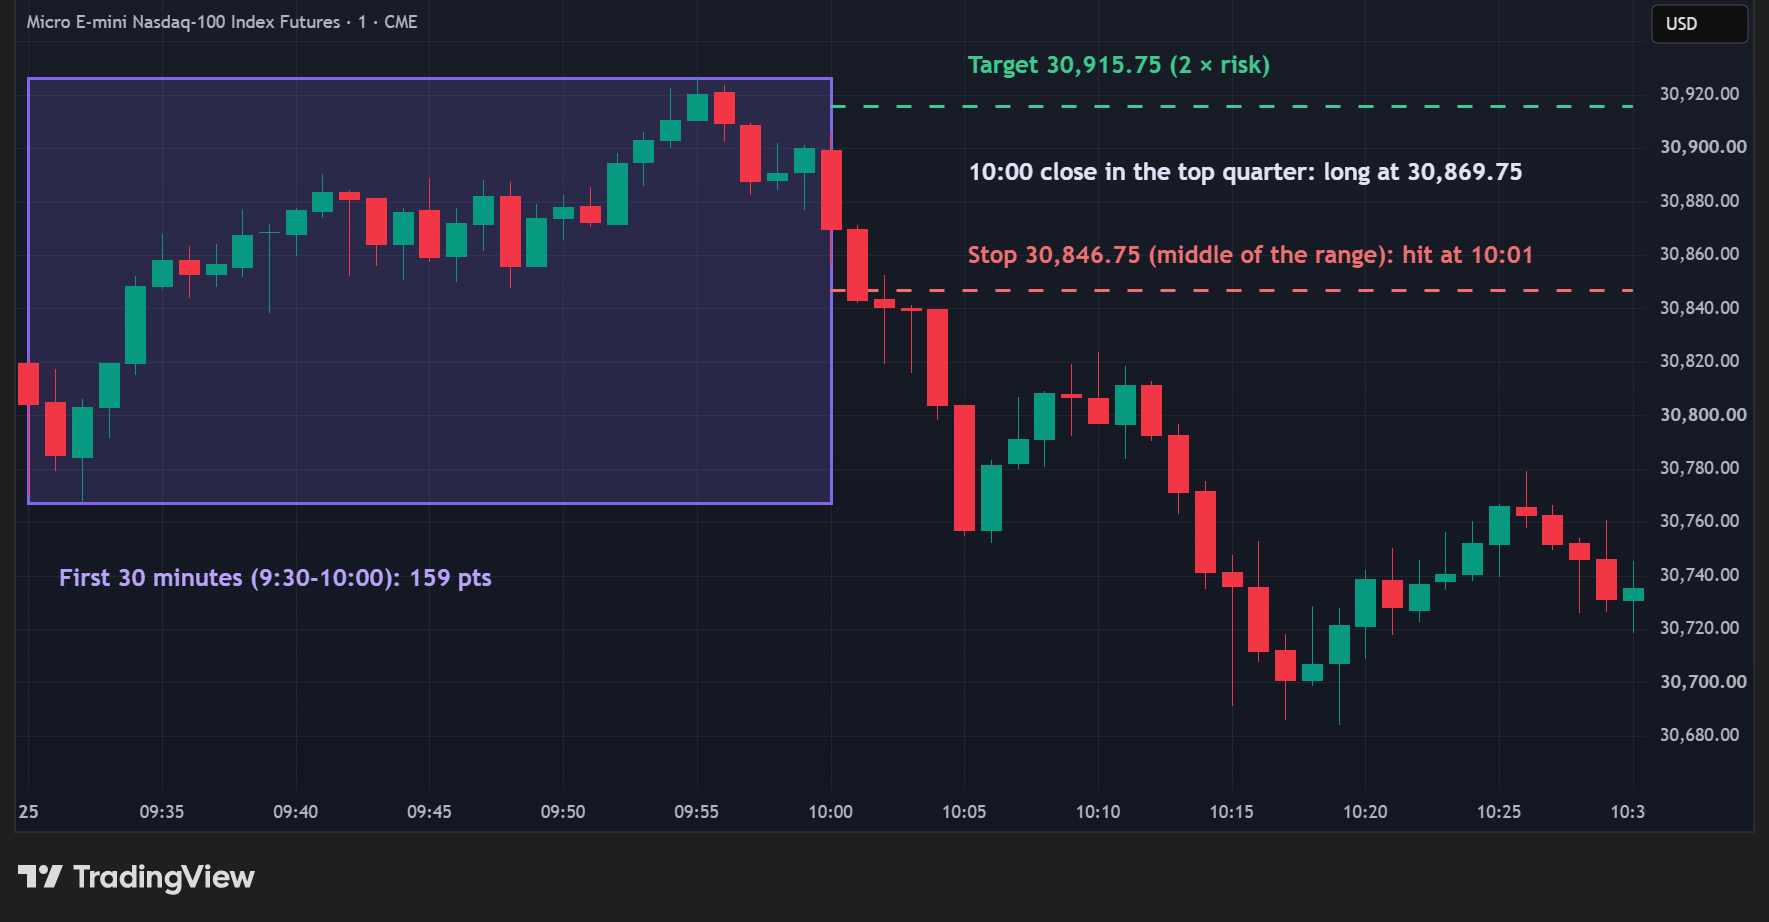
| Step | What the chart shows | Number |
|---|---|---|
| Range | High and low of the 9:30–9:59 ET bars | 159 pts |
| Direction | The 9:59 bar closed in the top quarter of the range | long |
| Entry | Close of the 10:00 bar, which fell back toward the middle | 30,869.75 |
| Stop | Middle of the range (on a tick, no rounding) | 30,846.75, 23 pts away |
| Target | Entry + 2 × 23 | 30,915.75, 46 pts away |
| Outcome | Stop traded at 10:01, the next bar | 23 × $2 = −$46 per MNQ |
Same rules, and the half hour again finished in its top quarter. But the entry is the next bar's close, and on
25 September the 10:00 bar fell back toward the middle, so the entry sat only 23 points above the stop. The stop
traded one minute later. A 23-point stop is not a safer trade, just a smaller one: 23 × $2 = $46 a
micro, known before the entry.
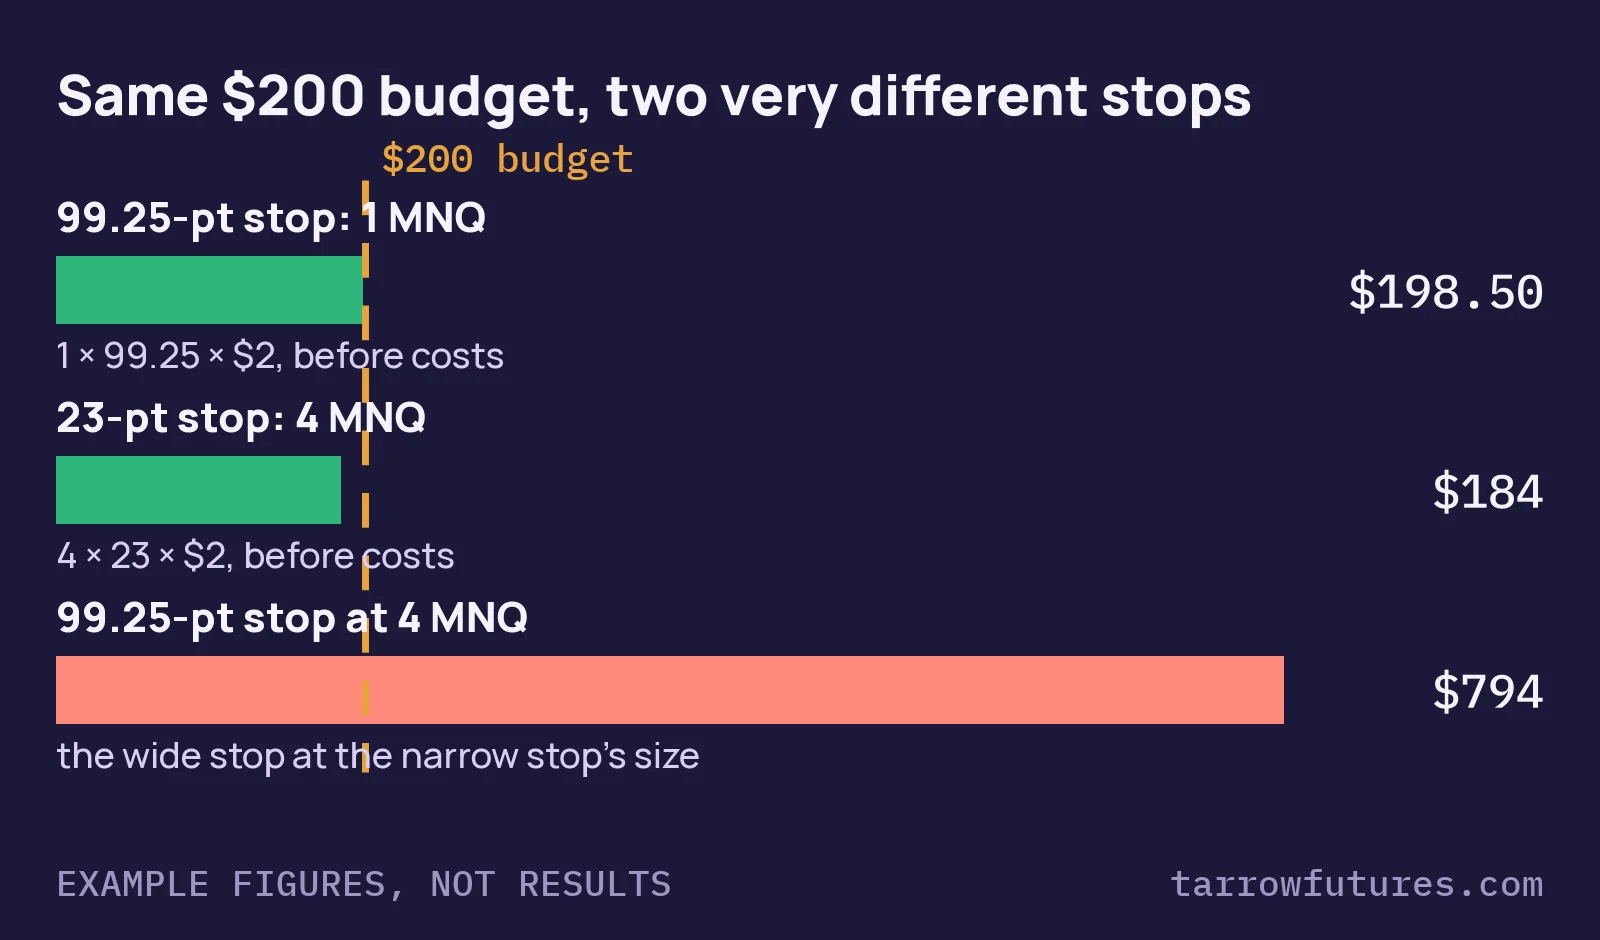
Size from the stop, not the setup. With $200 a trade (example budget), rule 8 gives $200 ÷ $46 = 4.35,
rounded down to 4 MNQ on 25 September (a $184 loss), and $200 ÷ $198.50 = 1.01, rounded
down to 1 MNQ on 21 September. The danger runs the other way too: the 4 MNQ that fit a
23-point stop would have risked 4 × $198.50 = $794 on the 99.25-point stop of
21 September.
Can you tell a 25 September in advance? A filter such as "skip the day if the 10:00 bar closes back near the middle" may sound sensible, but we have not tested one and do not offer one. Test any filter on many sessions before trusting it.
CFTC Rule 4.41: Hypothetical or simulated performance results have certain limitations. Unlike an actual performance record, simulated results do not represent actual trading. Also, since the trades have not been executed, the results may have under- or over-compensated for the impact, if any, of certain market factors, such as lack of liquidity. Simulated trading programs in general are also subject to the fact that they are designed with the benefit of hindsight. No representation is being made that any account will or is likely to achieve profit or losses similar to those shown.
4. How it fits prop firm rules
Daily loss limit: size from the stop
Decide how much one stop may cost, then divide by the cost of one contract's stop. Example figures: with $200 a
trade, 21 September is 1 MNQ and 25 September is 4. Check the result against your daily limit as well:
at a fixed 4 MNQ, the 21 September stop was $794, most of a $1,000 daily loss limit
(example limit) in one trade. On NQ, at $20 a point, the 21 September stop was $1,985 for a single
contract.
Trailing drawdown: a long hold gives open profit time to move the floor
The trade starts at 10:00 and can run until 15:50. On 21 September it was open from 10:00 until the target at 11:39. Under an
intraday trailing drawdown the floor follows your highest balance, open trades included. Example figures, not results: at
1 MNQ with a 99.25-point stop, a trade that runs to +150 points open (+$300)
from a new balance high and then reverses to the stop (−$198.50) lifts the floor $300 and drops the
balance $198.50, so the room left shrinks by $498.50, not $198.50. Check the stop × size
against the room you have after the floor has trailed, not against the account size.
Consistency rule: one target can be a big day
With a 2 × risk target and one trade a day, a target day is twice a stop day. Example figures: at 1 MNQ on
21 September, the target was $397. Under a consistency rule that caps your best day at half of total profit
(example rule), a $397 best day needs total profit of at least $397 × 2 = $794 before it fits. Rules
differ by firm; check yours.
Close-out time
The card's 15:50 ET exit is ours. Many firms set their own time by which positions must be flat; if yours is
earlier, it becomes the time exit. Check your firm's current rulebook.
5. Test it yourself before you trade it
- Write the card down exactly. Session times and time zone, bar size, which bar's close sets the direction (the 9:59 bar) and which bar's close is the entry (the 10:00 bar), the quarter cut-off, the minimum range, the stop and how it is rounded, the target, the time exit and one trade a day. If two people could code it differently, it is not finished.
- Backtest it on your contract, many sessions. Record each day's range, where the 9:59 close sat, and the distance from the entry to the middle as well as the outcome; that distance is your risk.
- Count the no-trade days. Days under the minimum range or with a close in the middle half are part of the strategy. Know how often you would sit out.
- Add costs. Commission both ways and slippage on every fill, more on stops in fast markets. A stop that is hit a minute after the entry is exactly where slippage shows up, so model it as a cost.
- Run your size through the rules. Longest losing streak × risk per trade against your daily limit and your trailing drawdown, then forward-test on a simulator for weeks before any paid evaluation.
Know a trader learning this strategy? Send them this breakdown. It's free for them too.
Disclosures
Education only. This page explains how a widely known, public strategy is defined and how you could test it yourself. It is not advice, not a recommendation to trade any contract, size or strategy, and not a signal: it shows no setup for any future session. Charts are real past sessions, chosen to show the rules (including a day they failed); they are selected examples, not typical results. The charts are TradingView snapshots (MNQ1!, regular trading hours, one-minute unless the caption says otherwise; a volume profile, where shown, is TradingView's built-in Fixed Range Volume Profile); diagrams labelled as illustrations are drawn by Tarrow Futures and are not market data. The level, range, entry, stop and target marks and labels on them were added by Tarrow Futures. Bars may differ slightly from those on your platform. Trade outcomes on this page are what the written rules would have done on those days, before commissions and slippage. They are not trades Tarrow Futures placed. Dollar figures for sequences and rules are example figures, not results. Prop firm rules differ and change; your firm's current rulebook decides. Futures trading involves substantial risk of loss. Automation does not remove risk.
CFTC Rule 4.41: Hypothetical or simulated performance results have certain limitations. Unlike an actual performance record, simulated results do not represent actual trading. Also, since the trades have not been executed, the results may have under- or over-compensated for the impact, if any, of certain market factors, such as lack of liquidity. Simulated trading programs in general are also subject to the fact that they are designed with the benefit of hindsight. No representation is being made that any account will or is likely to achieve profit or losses similar to those shown.