Futures Basics
What is order flow in futures trading?
Order flow is the record of who traded at each price: buyers paying the offer or sellers hitting the bid. A buy market order trades against the resting offers and a sell market order against the resting bids, so splitting the volume by side shows which side was crossing the spread. Order flow traders read that on four tools: the depth of market, time and sales, footprint charts and delta.
None of it says where price goes next. It describes what already traded and what is resting in the book right now. This post explains each tool with worked example figures in MNQ, then looks at how a small-stop order flow plan sits inside prop firm rules. CME Group's contract specs set MNQ at 0.25 points a tick and $2 a point, so one tick is $0.50 a micro.
Free printable · free with your email
Contract Specs Card
Tick size, tick value and point value for the futures prop traders use most, on one card.
✓ It's yours. The link is on its way to your inbox.
Check your inbox in the next few minutes.
Two kinds of order, one trade
Every futures trade matches two orders:
- A resting limit order. It sits in the book at a price and waits. Limit buyers make up the bid; limit sellers make up the offer (the ask).
- An aggressive order. A market order, or a limit order priced through the other side, that trades immediately against what is resting.
If MNQ shows 21,000.00 bid and 21,000.25 offered, a buy market order for 5 contracts trades 5 at 21,000.25, against the offer. That trade is counted as at the ask. A sell market order trades at 21,000.00 and is counted at the bid. Order flow tools are built on that split.
The depth of market (DOM)
The DOM, or price ladder, lists the resting limit orders at each price near the market: size bid below, size offered above. CME's aggregated market-by-price feed for futures carries a book up to 10 price levels deep on each side; its order-level feed carries more (CME Group client documentation, MDP 3.0 Market by Price multiple-depth book, read 2026-11-07).
What the DOM shows is intent, not commitment. A resting order can be cancelled before price reaches it, so a large bid two ticks below the market may not be there when price gets there. Reading the DOM means watching how size changes as price approaches, not counting it once.
Time and sales (the tape)
Time and sales lists every trade as it prints: time, price, size and, on most platforms, whether it traded at the bid or the ask. It is the raw record the other tools summarise. On a fast day it scrolls faster than anyone can read, which is why most traders use the summaries below.
Footprint charts
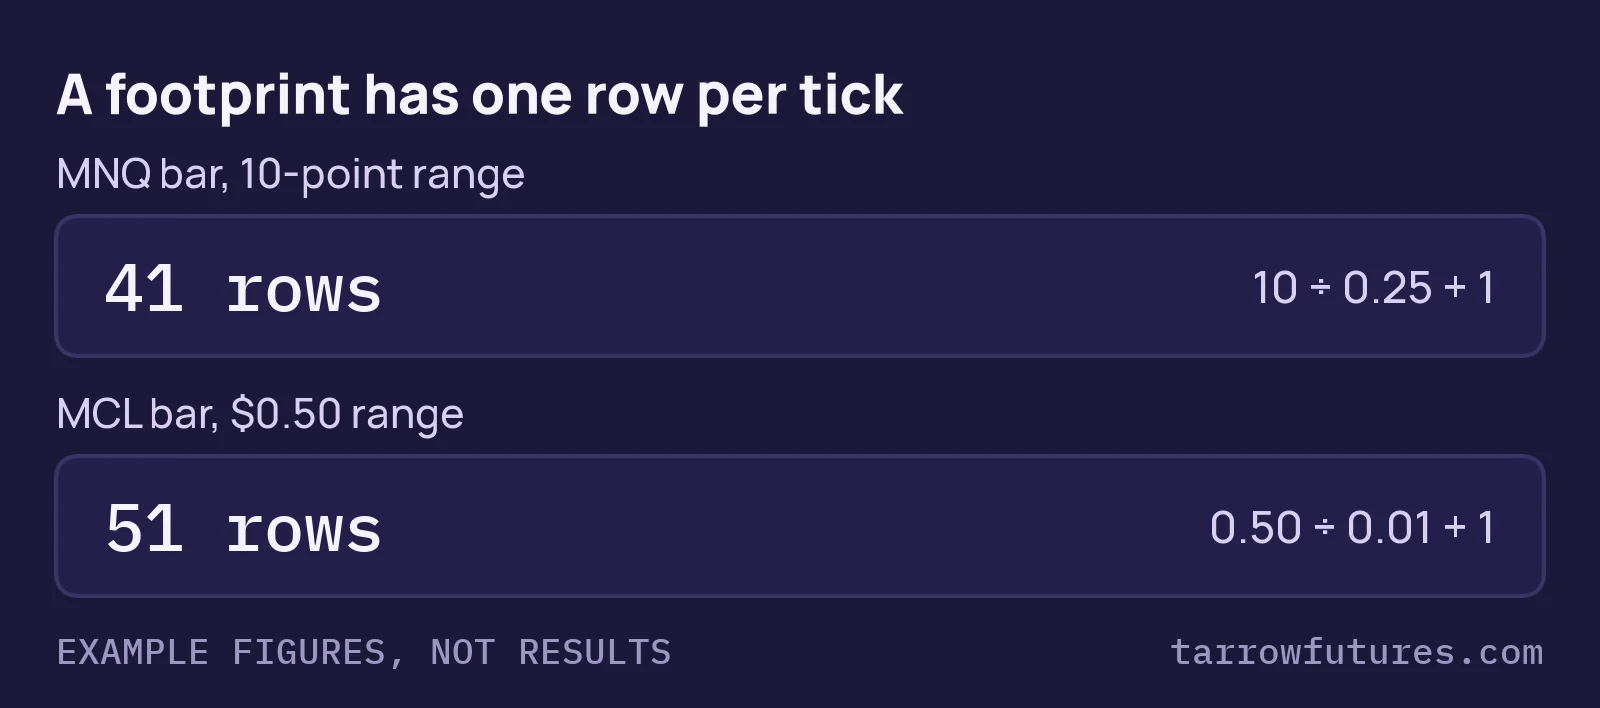
A footprint chart keeps the bar but splits it into one row per tick, with the volume traded at the bid and at the ask in each row. The number of rows comes straight from the tick size:
rows = bar range in points ÷ tick size + 1
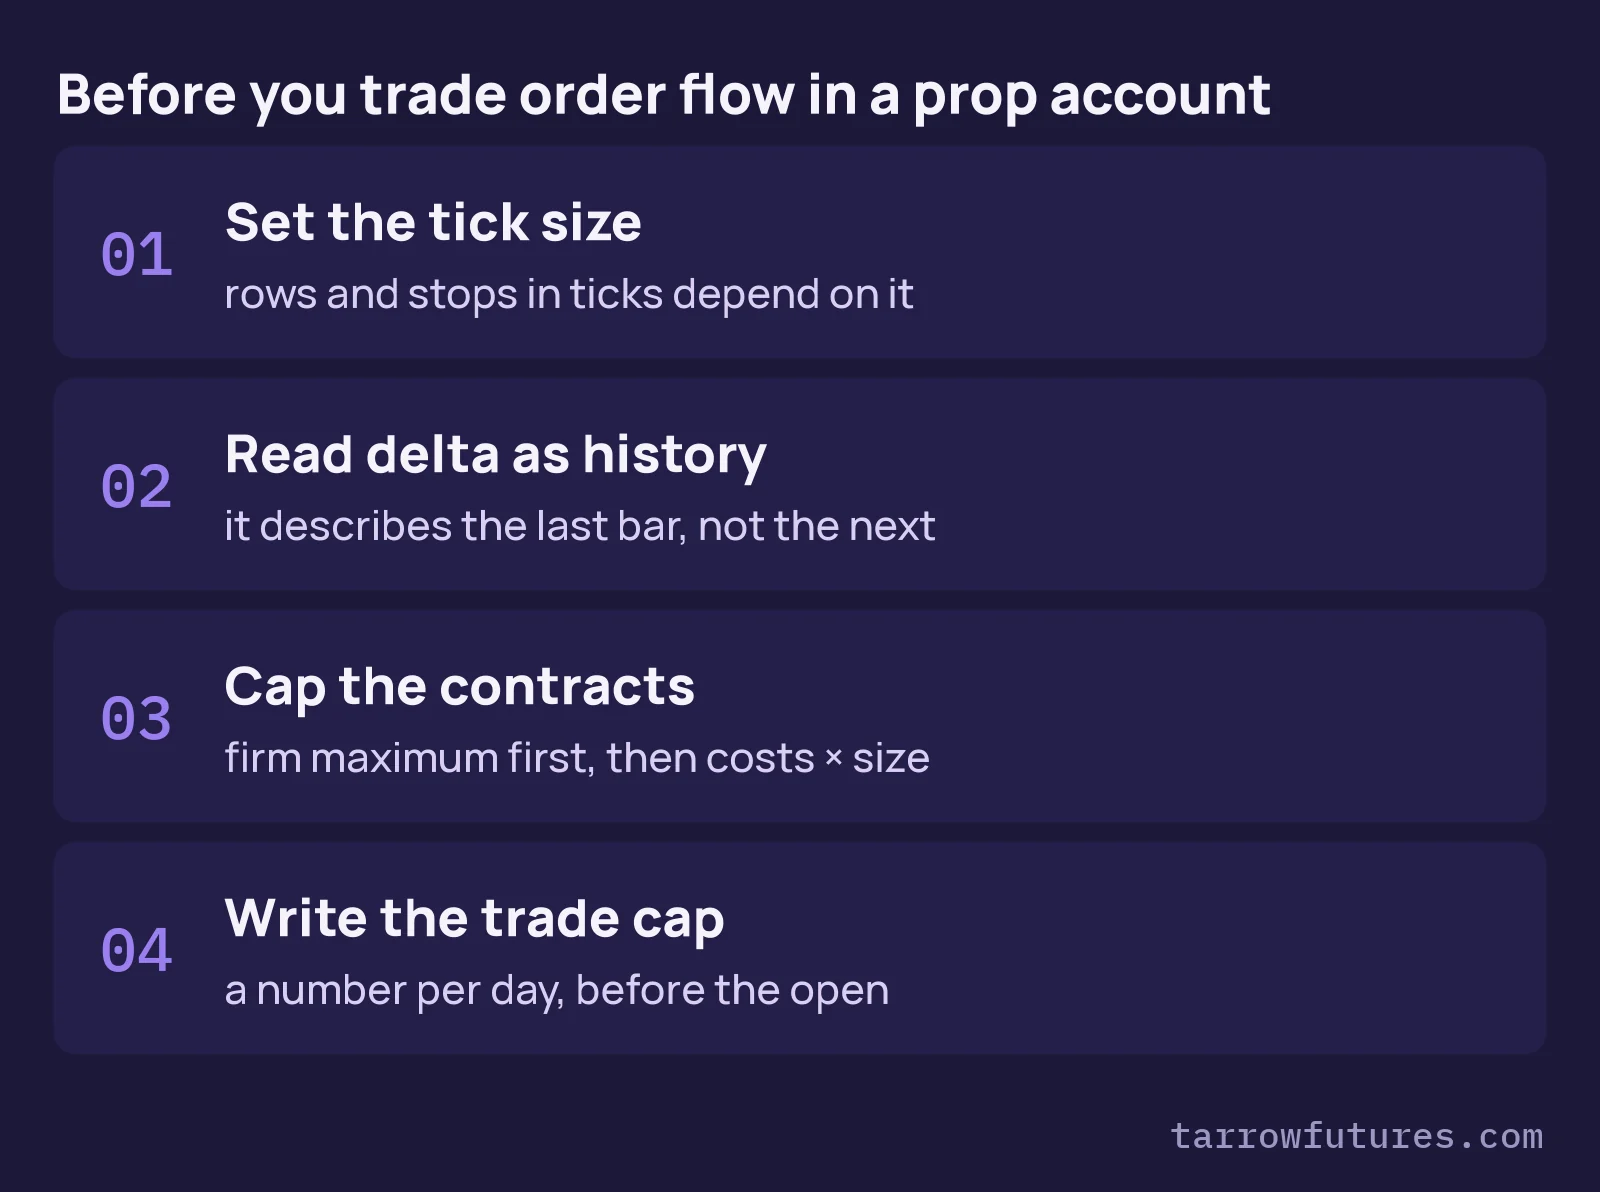
On MNQ a bar with a 10-point range has 10 ÷ 0.25 + 1 = 41 rows. On Micro Crude (MCL), where a tick is $0.01, a bar with a $0.50 range has 51. That is why the same footprint settings look crowded on one contract and empty on another, and why the tick size from the contract specs is the first setting to check.
Delta and cumulative delta
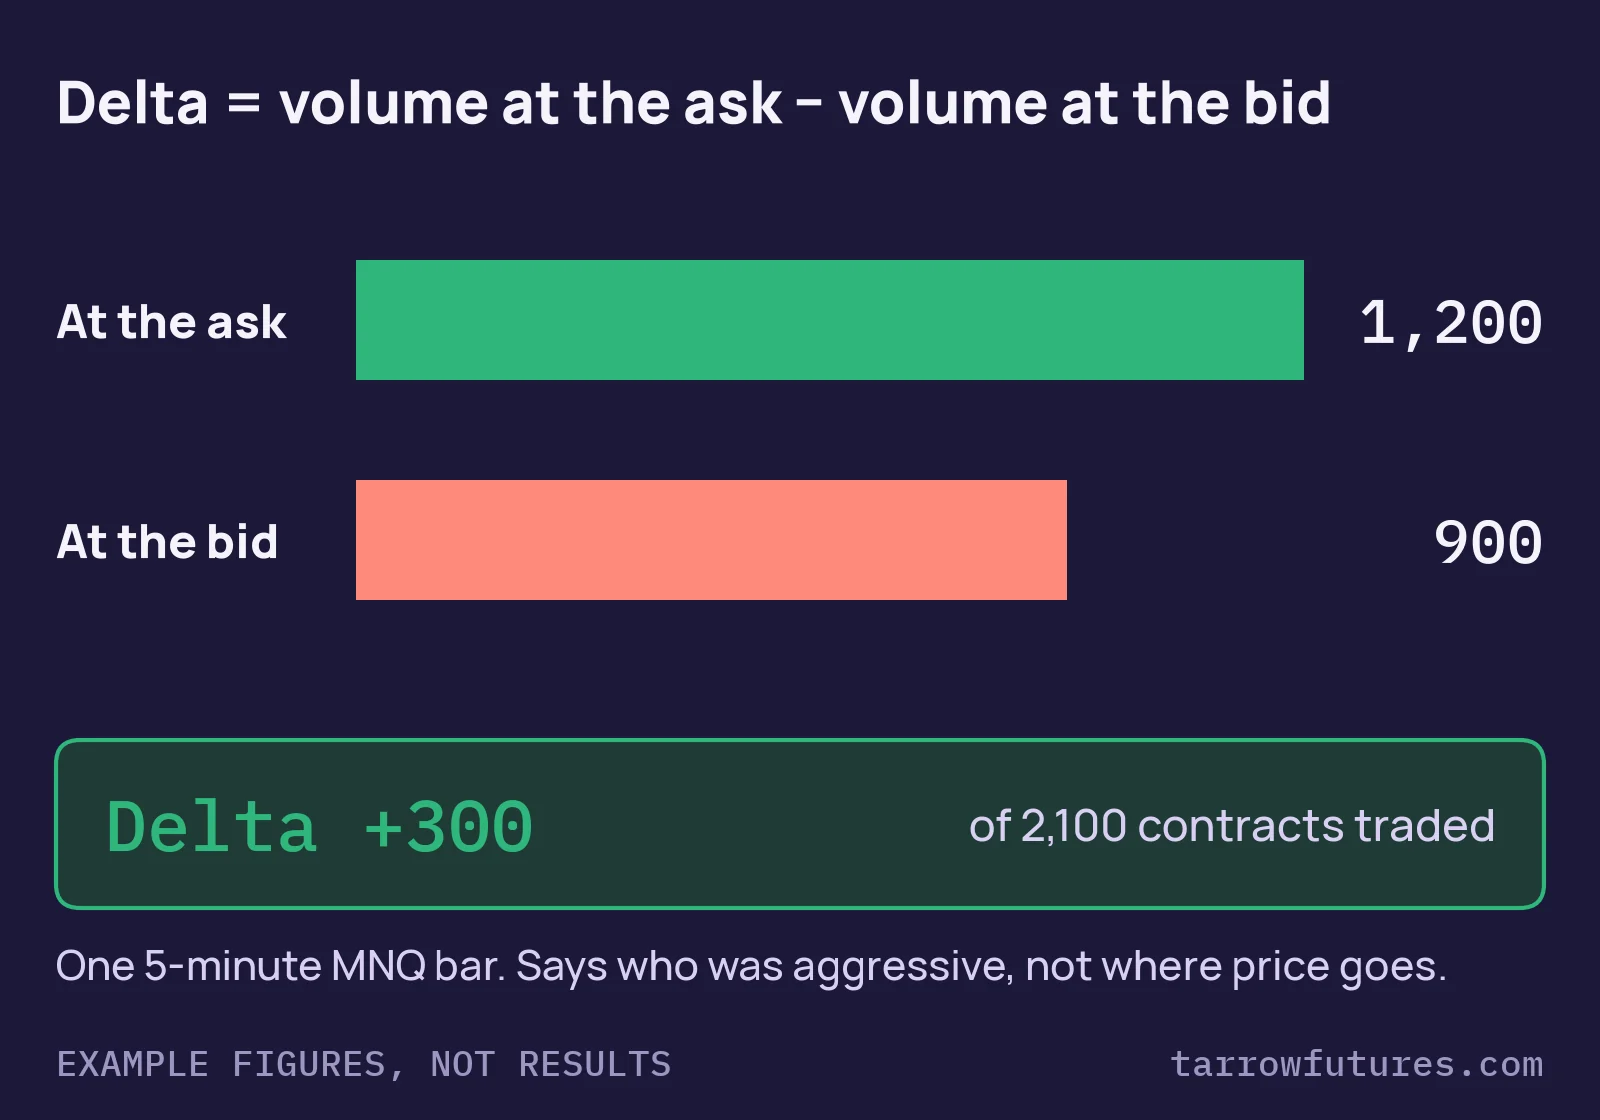
Delta is the ask volume minus the bid volume. Example figures for one 5-minute MNQ bar:
1,200contracts traded at the ask,900at the bid- Delta =
1,200 − 900 = +300 - Total volume =
1,200 + 900 = 2,100contracts
Cumulative delta adds each bar's delta to a running total through the session. Three bars of +300, −150 and +100 leave cumulative delta at +250.
A positive delta says buyers were the more aggressive side over that bar. It does not say price rose, and it doesn't say price will. A bar can close lower on positive delta when aggressive buyers trade into large resting offers that don't give way; order flow traders call that absorption. Reading it is a judgement, which is the hard part of order flow.
How an order flow plan fits prop firm rules
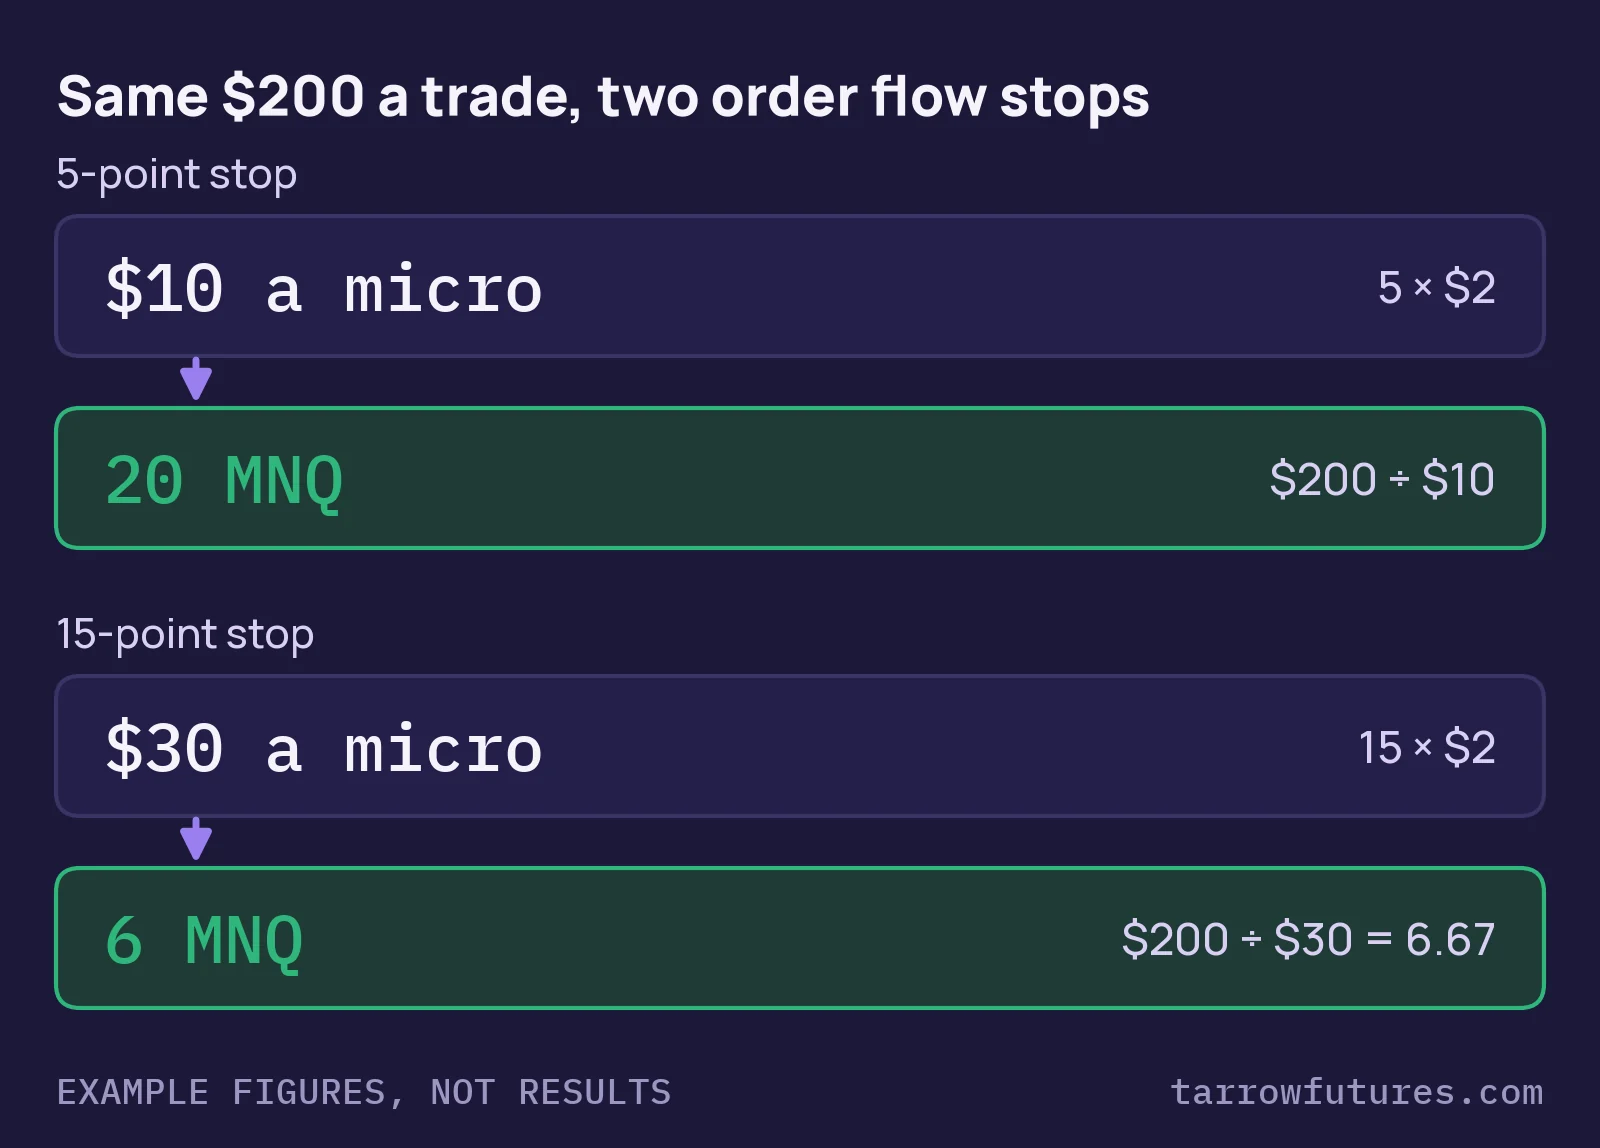
Order flow entries are usually timed off a level and a read of the tape, so stops tend to be small. In futures trading strategies ranked by difficulty the order flow row uses 5 to 15 points on MNQ as an illustrative stop, $10 to $30 a micro.
The sizing formula is the money you allow per trade ÷ (stop in points × point value), rounded down. Example figures, $200 a trade:
5-point stop:$200 ÷ $10 = 20MNQ15-point stop:$200 ÷ $30 = 6.67, so6MNQ
Three rules usually bite before the reads do:
- Maximum contracts.
20micros can be over a firm's limit or its scaling plan for a new account. Cap the answer at whichever is lower. - Costs. At
20MNQ, one tick of slippage on the way in and one on the way out is20 × $1 = $20a trade (example figures), a tenth of the$200budget before commission. Can you scalp futures in a prop account works through costs on small stops. - The daily loss limit. Small stops invite more attempts. At
$200a loser, a$1,000daily limit holds5full losses. Decide the trade cap before the open.
Some rulebooks also restrict very short holding times, which order flow scalps can run into. Search yours for "hold" and "seconds".
Testing an order flow rule
A normal backtest runs on bars: open, high, low, close and volume. Bars can't show which side each trade hit, so they can't test a delta rule or a footprint read. Testing order flow needs tick data with the aggressor side recorded, and rules written as numbers, for example "delta below −200 on a bar that touches the prior-day low, enter long on the next bar's close". A read that can't be written that way can't be tested, only practised.
Your charting platform's data can also differ from the record the firm's engine uses for your fills and your drawdown. Check a few trades against the firm's statement before trusting a platform's numbers.
Common mistakes
- Treating delta as a forecast. It describes the bar that just finished. Price can move against it.
- Trusting size on the DOM. Resting orders can be cancelled before price arrives.
- Wrong tick size in the footprint. Rows, delta per row and stop in ticks all depend on it; take it from the contract specs.
- Sizing to the maximum because the stop is small. Twenty micros multiplies costs and slippage by twenty.
- No written trade cap. Small stops make the tenth attempt feel cheap; the daily limit doesn't care.
Know your ticks first
Every order flow tool counts in ticks, and tick sizes differ by contract: 0.25 points on MNQ and MES, $0.10 on Micro Gold, $0.01 on Micro Crude. The free Contract Specs Card puts tick size, tick value and point value for 12 CME micro and mini contracts on one printable page; it is free with your email, below.
Educational only. Not financial advice. Contract specifications: CME Group (MNQ tick 0.25 point, $2 per point; MCL tick $0.01; MGC tick $0.10). Book depth: CME Group MDP 3.0 documentation, read 2026-11-07. Volume, delta, slippage and sizing figures are examples, not results or quotes.
Free printable · free with your email
Contract Specs Card
Tick size, tick value and point value for the futures prop traders use most, on one card. We email you the link, so it is one tap away next time.
✓ It's yours. The link is on its way to your inbox.
Check your inbox in the next few minutes.
Questions
What is order flow in futures trading?
Order flow is the stream of orders and trades in a market, read to see whether buyers or sellers were the aggressive side at each price. A buy market order trades at the offer and a sell market order trades at the bid, so splitting volume by side shows who was crossing the spread. Traders read it on the depth of market, time and sales, footprint charts and delta.
What is delta in order flow?
Delta is the volume traded at the offer minus the volume traded at the bid over a bar or a session. With example figures of 1,200 contracts at the offer and 900 at the bid, a bar's delta is +300. Cumulative delta adds each bar's delta to a running total. A positive delta says buyers were more aggressive; it does not say price will rise.
What is a footprint chart?
A footprint chart splits each bar into one row per tick and shows the volume traded at the bid and at the offer in each row. On MNQ, where a tick is 0.25 points, a bar with a 10-point range has 41 price rows (10 ÷ 0.25 + 1).
Can you backtest an order flow strategy?
Only with tick data that records which side each trade hit, and only if the rules are written as numbers, such as a delta threshold and a price level. Bar data (open, high, low, close, volume) can't show bid and ask volume, so a normal bar backtest can't test an order flow rule.
Is order flow trading allowed in a prop firm account?
Order flow is a way of reading the market, not an order type, and rulebooks rarely mention it. The rules that usually matter are the ones on very short holding times, maximum contracts and the daily loss limit, because order flow plans often use small stops and many contracts. Read your firm's current rulebook before trading.
Educational material only. Not financial, investment or trading advice, and not a recommendation to trade any contract or size. Prop firm rules differ and change; the current rulebook of the firm you use decides. Worked examples use example figures, not results. Futures trading involves substantial risk of loss. Evaluations are paid tests and most people who take one do not pass.